Green energy stopped being an aspiration a while ago. Solar and wind are now the cheapest new sources of electricity in most of the world, renewables supply a growing share of the grid in every major economy, and the technology curve is still bending downward. This guide lays out what renewable energy actually is, how the major types compare, what the emissions and cost data say, and — because we sell the equipment — how the global picture connects to the decisions a homeowner, installer, or facility manager makes this year.

What Is Renewable Energy?
Renewable (green) energy comes from sources that nature replenishes faster than humans consume them: sunlight, wind, moving water, geothermal heat, and biomass. The contrast with fossil fuels isn't just environmental — it's structural. A coal plant buys its fuel every day forever; a solar array buys its fuel once, at installation, in the form of hardware. That single difference drives most of the economics, security, and environmental math that follows.
| Characteristic | Renewable Energy | Non-Renewable Energy |
|---|---|---|
| Source | Sun, wind, water, geothermal heat, biomass | Coal, oil, natural gas, nuclear |
| Regeneration | Continuous (days to years) | Millions of years |
| Supply | Essentially unlimited | Finite, depleting |
| Carbon Emissions | Zero to minimal during operation | Significant CO₂ and other greenhouse gases |
| Air Pollution | Minimal to none | Sulfur dioxide, nitrogen oxides, particulates |
| Water Usage | Low (solar, wind) to moderate (hydro) | High (cooling, processing) |
| Price Stability | Stable (no fuel costs after installation) | Volatile (subject to market fluctuations) |
| Energy Independence | Promotes local/national energy security | Often depends on imports |
Having designed and supplied systems across the spectrum, I can tell you the table above isn't abstract: the "price stability" row is the one that converts skeptics. Once a system is installed, the fuel cost line goes to zero and stays there — no utility rate case, no gas contract, no diesel delivery can touch it.
Environmental Benefits, Quantified
Greenhouse Gas Emissions
Lifecycle analyses — which count manufacturing, transport, construction, operation, and decommissioning, not just the smokestack — put renewables orders of magnitude below fossil generation:
| Energy Source | CO₂ Emissions (g/kWh) | Relative Impact |
|---|---|---|
| Coal | 820–1,200 | Highest |
| Natural Gas | 410–520 | High |
| Biomass | 45–230* | Low–Moderate |
| Solar PV | 20–50 | Very Low |
| Wind | 7–15 | Minimal |
| Hydroelectric | 4–25 | Minimal |
| Geothermal | 15–55 | Very Low |
| Nuclear | 5–20 | Minimal |
Read the solar row carefully: even counting the full manufacturing footprint of panels, inverters, and racking, solar PV emits roughly 20–50 grams of CO₂ per kWh over its life — about 4–6% of a combined-cycle gas plant and under 3% of coal. A typical 8kW residential array producing ~10,000 kWh per year avoids on the order of 4–8 metric tons of CO₂ annually versus a fossil-heavy grid mix — the emissions equivalent of taking a car off the road.
Water Conservation
Power generation is one of the largest industrial uses of freshwater, mostly for cooling thermal plants. Solar PV and wind need essentially none:
| Energy Source | Water Consumption (gal/MWh) | Water Intensity |
|---|---|---|
| Nuclear | 400–720 | Very High |
| Coal | 300–500 | High |
| Natural Gas (Combined Cycle) | 150–300 | Moderate |
| Geothermal | 1–20 | Low |
| Solar PV | 0–5 | Minimal |
| Wind | 0–1 | Negligible |
In water-stressed regions — the American Southwest, much of the Mediterranean, northern India — this row of the ledger matters as much as carbon. A gigawatt of solar instead of gas saves hundreds of millions of gallons of water per year.
Air Quality and Public Health
| Pollutant | Health Effects | Renewable Energy Impact |
|---|---|---|
| Particulate Matter (PM2.5) | Respiratory disease, heart disease, stroke, lung cancer | Eliminated during operation |
| Ozone (ground-level) | Asthma attacks, reduced lung function, inflammation | Precursors (NOₓ) eliminated |
| Sulfur Dioxide | Respiratory irritation, aggravates asthma | Not produced |
| Mercury | Neurological damage, developmental disorders | Not released |
The health benefits arrive faster than the climate benefits. When a region shifts generation away from combustion, local particulate and NOₓ levels fall within months, and hospital admissions for asthma and cardiac events follow. This is why public-health agencies treat clean generation as preventive medicine at grid scale.
The Major Types of Renewable Energy
Solar Energy
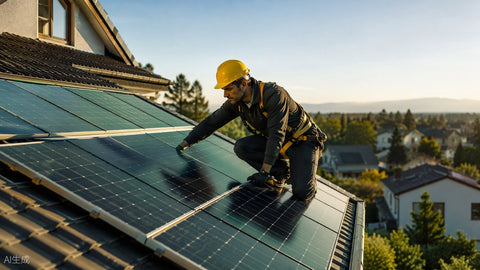
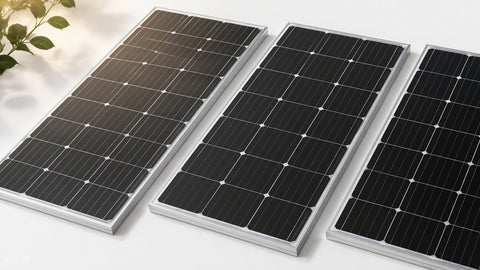
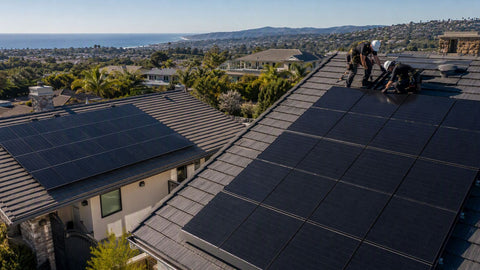
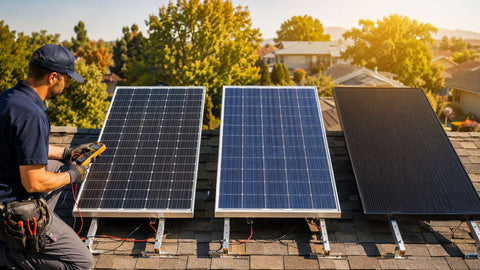
Solar photovoltaics convert sunlight directly to DC electricity, which an inverter converts to grid-synchronized AC. The technology's strengths are modularity (the same panel serves a cabin and a 500MW farm), zero moving parts, and a learning curve that has cut prices roughly 90% since 2010. Weaknesses: intermittency (night and clouds) and land or roof area. For component-level guidance, see our solar panel system components overview and the panel kits buyer's guide. browse current inventory in the 400–459W and 550–709W module classes.
Wind Energy
Wind is the workhorse of utility-scale renewables: onshore turbines in good resource areas deliver capacity factors of 35–45%, and offshore exceeds 50%. At the other end of the scale, small wind serves farms and off-grid properties with sustained average winds above ~10 mph — niche but real, and we stock small wind turbines and wind components for exactly those sites.
Hydroelectric Power
Hydro is the original renewable: reliable, dispatchable, and site-limited. It supplies roughly 16% of global electricity and provides the grid-balancing flexibility that makes variable solar and wind easier to integrate. New large hydro is rare in developed countries — the good sites are mostly built — but upgrading existing dams with modern turbines remains one of the cheapest clean-energy plays available.
Geothermal Energy
Geothermal taps the earth's heat for power and direct heating. Geographically limited for electricity (the western US, Iceland, East Africa, the Philippines), but where it exists it delivers 90%+ capacity factors — true baseload renewable power. Ground-source heat pumps, the residential cousin, work everywhere and cut heating and cooling energy use by 40–60%.
Biomass and Emerging Sources
Biomass — wood, agricultural residue, biogas — is renewable but not emission-free, which is why it sits in the middle of the emissions table. Its best use is firming: dispatchable power when the sun and wind are down. Green hydrogen, tidal, and wave energy remain pre-commercial at scale but are attracting serious capital for industrial decarbonization.
| Source | Availability | Consistency | Scalability | Cost Trend |
|---|---|---|---|---|
| Solar | Global (varies) | Intermittent (day) | Excellent | Rapidly declining |
| Wind | Regional | Variable | Good | Declining |
| Hydro | Site-specific | Reliable | Limited sites | Stable |
| Geothermal | Limited regions | Very reliable | Limited | Stable |
| Biomass | Where feedstock exists | Dispatchable | Moderate | Stable to rising |
The Economics: Costs That Keep Falling
The renewable cost revolution is the least appreciated story in modern energy. Lazard's annual levelized-cost analyses have tracked it for over a decade:
| Technology | Cost Decline (2010–2024) | Current LCOE* |
|---|---|---|
| Solar PV (Utility) | ~90% decrease | $0.03–0.05/kWh |
| Onshore Wind | ~70% decrease | $0.03–0.05/kWh |
| Offshore Wind | ~60% decrease | $0.07–0.12/kWh |
| Battery Storage | ~85% decrease | $150–250/kWh capacity |
Utility-scale solar and onshore wind now undercut the operating cost alone of many existing fossil plants — meaning it can be cheaper to build new renewables than to keep an old coal plant running. I've watched this play out in quotes: a commercial customer who balked at solar in 2018 at $3.20/W signed in 2025 at a fraction of that, with better equipment. The curve rewards the patient and punishes the waiting-for-perfection crowd about equally.
Degradation Math: What a Panel Is Worth in Year 25
One piece of honest arithmetic every buyer should know: solar modules degrade slowly — quality tier-1 panels carry degradation rates around 0.4–0.55% per year. Compounded over 25 years at 0.5% annually, a panel retains 0.995^25 ≈ 88.2% of its original output — which is why 25-year warranties guaranteeing 84–87% output are conservative, and why a 10kW array today is still a ~8.8kW array in 2051. The equipment outlasts most roofs it sits on; plan racking and flashing accordingly, and see our racking systems guide for the mounting side.
Energy Security and Independence
| Security Aspect | Fossil Fuel Vulnerability | Renewable Energy Advantage |
|---|---|---|
| Supply Disruption | Pipeline attacks, shipping disruptions, export bans | Domestic resources can't be embargoed |
| Price Volatility | OPEC decisions, geopolitical crises | Zero fuel costs after installation |
| Grid Resilience | Centralized plants create single points of failure | Distributed generation adds redundancy |
| Climate Impacts | Extreme weather damages infrastructure | Smaller installations recover faster |
Every kilowatt-hour generated domestically from sun or wind is one that can't be embargoed, blockaded, or repriced by a cartel. Europe's crash renewable buildout after 2022 was energy-security policy wearing environmental clothes. At the household scale, the same logic applies one roof at a time: a family with solar, a battery, and a standby generator has options in a crisis that a grid-only household simply doesn't.
Technology: Where the Frontier Is
| Technology | Innovation | Impact |
|---|---|---|
| Solar Cells | Perovskite, tandem cells, bifacial modules | Higher efficiency (25%+), lower costs |
| Wind Turbines | Larger rotors, taller towers, floating offshore | More energy per turbine, new site access |
| Battery Storage | Lithium-ion improvements, solid-state, flow batteries | Longer duration, lower cost, improved safety |
| Smart Grids | AI optimization, real-time monitoring, automated response | Better renewable integration, reduced losses |
| Inverters | Grid-forming capabilities, higher efficiency | Grid stability, reduced conversion losses |
| Geothermal | Enhanced geothermal systems (EGS) | Expanded geographic availability |
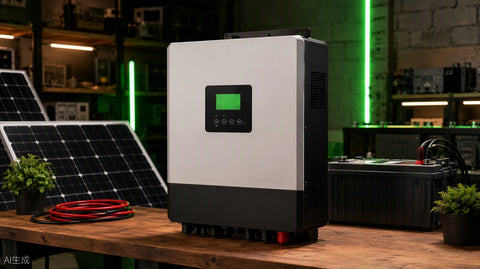
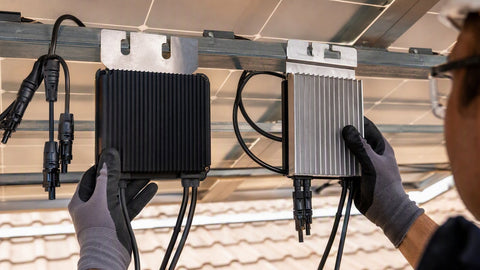
The near-term items worth watching: perovskite-silicon tandem cells pushing module efficiency past 25%, sodium-ion batteries entering stationary storage at lower cost per kWh, and inverter intelligence — grid-forming inverters that let renewables provide the stability services once exclusive to spinning turbines. Our hybrid inverter guide and inverter picks track the equipment side of that curve.
Global Adoption: Who's Leading
| Country | Renewable Leadership | Key Achievement |
|---|---|---|
| Denmark | Wind power pioneer | ~80% renewable electricity |
| Germany | Energiewende policy | 50%+ renewable electricity |
| China | Largest solar/wind capacity | 1,200+ GW renewable capacity |
| India | Rapid solar deployment | World's largest solar park |
| Iceland | Geothermal leader | ~100% renewable electricity |
| Costa Rica | Hydro + diverse mix | 99%+ renewable electricity |
| United States | Technology innovation | Fastest-growing energy source |
The leadership table hides the more interesting fact: adoption is no longer policy-dependent. When renewables are the cheapest option, they get built under governments of every description. Global solar installations have exceeded 400 GW of new capacity per year in recent years, and annual additions keep setting records — the transition has become a market phenomenon, not a subsidy artifact.
Rooftop vs. Utility-Scale: Two Different Machines
Solar's modularity means the same silicon shows up in two very different economic machines, and conflating them produces bad decisions in both directions.
Utility-scale solar buys land or leases it, builds at $0.80–1.10/W all-in, and sells power at wholesale. Its enemy is interconnection queues — in several US regions, projects wait 3–5 years for grid studies. Its virtue is raw cost: nothing generates a cheaper electron at noon.
Rooftop and distributed solar costs more per watt ($2.50–3.50/W residential, before incentives) but competes against retail electricity prices of $0.12–0.30/kWh rather than wholesale prices of $0.03–0.06. That retail-versus-wholesale gap is why rooftop economics work at all, and why net-metering policy moves the market so violently. It also means distributed solar's real competitor isn't the coal plant — it's the utility bill. Any analysis that compares rooftop solar's cost to wholesale power prices is answering the wrong question.
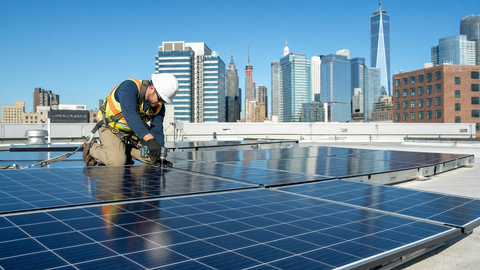
Commercial rooftops sit between the two: better $/W than residential, retail-rate offset, and often the best risk-adjusted return in the entire solar market. Our commercial cost breakdown runs those numbers in detail.
Land, Materials, and End-of-Life: The Honest Objections
Serious guides answer the serious objections, so here they are.
Land use. A utility solar farm needs roughly 5–8 acres per megawatt. Powering the entire US with solar alone would require on the order of 0.5–1% of the country's land area — a lot in absolute terms, less than the footprint of golf courses, and a fraction of the land already disturbed by fossil extraction. Agrivoltaics (elevated arrays over grazing or shade-tolerant crops) and rooftop-first policies shrink the number further.
Critical minerals. Solar needs silver, silicon, aluminum, and copper; batteries need lithium, and in some chemistries cobalt and nickel. Supply chains for these are concentrated, which is a real strategic concern — the answer is diversification, recycling, and chemistry shifts (LFP batteries eliminated cobalt from a huge share of the market; sodium-ion removes lithium itself). The fossil system, note, has the same problem every single day at the fuel dock rather than once at manufacture.
Panel recycling. A solar panel is roughly 75% glass and 10% aluminum by weight — both trivially recyclable — plus silicon, silver, and copper worth recovering. Dedicated PV recycling capacity is scaling in the US and EU, and the EU's WEEE directive already mandates panel take-back. By the time today's installations retire en masse in the 2040s, recycling economics will be driven by a mountain of recoverable silver and silicon. Design-for-recycling is now a selling point among tier-1 manufacturers — we've watched the datasheets add recycled-content lines in just the last few product generations.
Jobs and Local Economies

Renewable energy is labor-intensive in a way fossil generation is not: most of the money in a solar project goes to installation, electrical work, racking, and site labor rather than fuel. Globally, the sector employs well over 13 million people and climbing, with solar PV the largest single employer. In the US, solar installer and wind technician have ranked among the fastest-growing occupations for a decade running. The jobs are also geographically distributed — every rooftop is a local job that cannot be offshored, which is why the trades have become the transition's most durable constituency.
There's a distributor's-eye version of this: our busiest counters are the ones near installer training programs. When a community college starts a solar-track program, order volume follows within eighteen months. Workforce pipelines predict market growth more reliably than any policy forecast I've read.
Policy: What Actually Moves the Needle
After watching a decade of policy cycles, the instruments that demonstrably accelerate adoption:
- Long-horizon tax credits. Multi-year certainty (like the US federal investment tax credit's extensions) lets developers finance and lets manufacturers build factories. One-year cliff-edge credits produce boom-bust whiplash instead.
- Net metering and fair export rates. Rooftop solar lives or dies on what the utility pays for exported power. Markets with durable, predictable export compensation have stable rooftop industries; markets that retroactively slash them get lawsuits and bankruptcies.
- Permitting reform. In much of the US, permitting, inspection, and interconnection "soft costs" exceed the hardware cost of a residential system. Jurisdictions with instant online permitting (SolarAPP+ and similar) cut weeks and hundreds of dollars per install.
- Interconnection queue reform. The single biggest bottleneck for utility-scale clean energy is the study queue, not the technology or the capital.
Myths That Refuse to Die
"Panels don't work in winter." Cold improves panel efficiency; short days reduce hours, not capability. Annual output is what matters, and snow slides off tilted glass surprisingly fast.
"Manufacturing a panel takes more energy than it makes." Energy payback for modern PV is roughly 1–2 years depending on location, against a 25–30 year service life. The ratio isn't close.
"The grid can't handle renewables." Grids handle variability constantly — demand swings are larger and less predictable than solar output. High-renewable grids in Denmark, South Australia, and increasingly California operate reliably with storage, interconnection, and modern grid-forming inverters. The engineering is solved; the buildout is what's left.
"Green energy requires sacrifice." The installed cost curves say the opposite: the clean option is now usually the cheap option, and the household version adds resilience the grid-only home lacks. Sacrifice framing is a decade out of date.
What the Next Decade Looks Like
Three trends define the 2026–2035 window. First, storage attaches to everything: batteries are following the solar cost curve down, and pairing rates on new installations climb every quarter — the storage sizing math that was exotic five years ago is now standard practice. Second, electrification merges the energy decisions: the roof, the car, the heating system, and the backup plan become one integrated design, which is why our catalog spans modules through EV chargers to standby generation. Third, emerging markets leapfrog: countries that never built universal fossil grids are deploying solar-plus-storage minigrids directly, the same way mobile phones skipped landlines.
The honest summary after two decades of watching this industry: the physics won, the economics followed, and the remaining fight is logistics — interconnection queues, permitting, workforce, and supply chains. Those are solvable, unglamorous problems, and they're exactly the ones worth working on, because every one of them converts directly into built projects and flowing electrons.
Getting Started at Your Scale
Global trends are interesting; your roof, facility, or project is actionable. The sequence we walk customers through:
- Know your load. Pull 12 months of utility bills and find your annual kWh. Our system size calculator converts that into array size.
- Check your resource and rules. Sun exposure, roof condition, local permitting, and utility interconnection policy. Can solar power a whole house? covers the honest math.
- Decide on storage. Grid-tied-only maximizes ROI where net metering is healthy; batteries add resilience and self-consumption where it isn't. The battery bank sizing guide helps.
- Buy equipment that matches the design. Modules, inverter, racking, and balance-of-system from one accountable source — our complete solar kits exist precisely for this.
- Permit, install, interconnect. In that order, with the paperwork treated as part of the work, not an afterthought.
The Numbers Behind One Home System
Global statistics persuade slowly; household arithmetic persuades fast. Take a real-world-shaped example: a home using 11,000 kWh per year in a region with 4.5 peak sun hours daily. A 7.5kW array produces roughly 7.5 × 4.5 × 365 ≈ 12,300 kWh annually before system losses, and about 10,500 kWh after the standard ~14% losses (inverter, wiring, soiling, temperature). Against a $0.17/kWh utility rate, that's about $1,785 per year of avoided purchases — and every future rate increase raises the system's value, because the fuel was prepaid at installation.
Scale that single roof by the tens of millions of suitable rooftops in the US alone and the aggregate numbers get serious quickly: distributed solar at full rooftop potential could supply a large double-digit share of national electricity demand without disturbing an acre of undisturbed land. The constraint was never the resource. It was cost — which collapsed — and now process, which is the current frontier.
The same arithmetic works for businesses with flatter, bigger roofs and daytime-weighted loads that match solar's production curve almost perfectly. A warehouse's consumption peaks when the array produces; self-consumption ratios above 80% are common without a battery, which is why commercial solar's payback math has become the easiest capital request many CFOs see all year.
Renewables and Grid Resilience
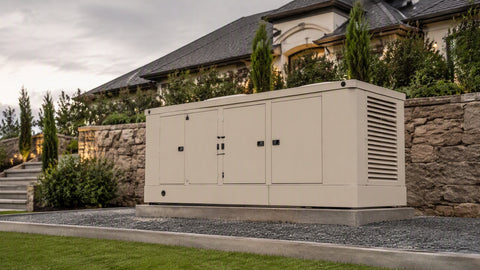
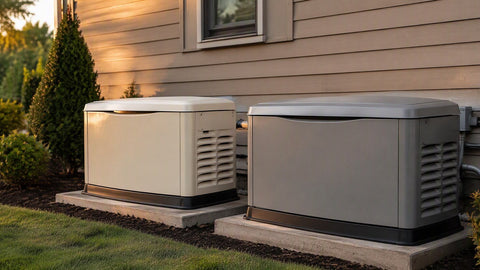
The resilience argument for renewables gets made badly so often that it's worth making precisely. A grid-tied solar array without storage does nothing during an outage — anti-islanding rules shut it down to protect lineworkers, full stop. The resilience comes from architecture, not the panels: solar plus battery plus a properly designed backup interface keeps a home or facility islanded and running, indefinitely if the array can outproduce daily consumption. Add a generator and the system tolerates a week of storms; size the battery honestly and it tolerates the nights too.
At grid scale, the resilience story is different but real: distributed generation fails gracefully. A central plant outage removes a gigawatt at once; a cloud bank removes a few percent of a million roofs. Hurricane seasons have repeatedly shown solar-plus-storage facilities returning to service hours after landfall while centralized infrastructure waits days for substation repairs. Resilience in the 2020s is a design choice, and renewable-based microgrids are increasingly the design that wins.
I've commissioned enough of these systems to have a standing opinion: the resilience dividend is underpriced by everyone — buyers, insurers, and policymakers alike — because it's invisible until the day it's the only thing that matters. Then it's priceless for about a week, and forgotten again until the next storm. Buy it on a calm day; that's when it's cheap and available.
The View From the Supply Chain
Most commentary on the energy transition comes from policy shops and trading desks. The view from a distributor's warehouse is different — less abstract, more forklifts — and it sees trends early. What we see in 2026:
Module wattage keeps climbing. The residential pallet standard has marched from 300W to 400W to the 450–550W classes in a handful of product generations. Each step cuts racking, wiring, and labor per watt, which is why installed costs fall even when panel prices plateau.
Storage went from accessory to standard. Battery attach rates on new residential solar have climbed from single digits to a large share of quotes in markets with weakened net metering. The conversation shifted from "should I add a battery?" to "how much battery?" — the battery care practices that protect that investment are now part of every handoff.
The trades are converging. The electrician, the solar installer, the HVAC contractor, and the generator dealer are increasingly the same company. Electrification merges the scopes: one customer wants panels, a heat pump feed, an EV circuit, and backup power in a single project, and the supply house that stocks the whole stack serves them best.
Quality bifurcates. At the bottom of the market, no-name equipment chases price; at the top, tier-1 manufacturers compete on degradation warranties, recycling programs, and bankability. The middle is hollowing out. Our buying floor follows a simple rule: if we wouldn't install it on our own building, we don't stock it. That policy costs us some price-shopping business and saves us every warranty nightmare we've watched competitors absorb — a trade we'd make again every quarter.
None of these trends requires a forecast — they're visible in this month's order flow. That's the practical advantage of watching the transition from the supply side: the data arrives on pallets. Policy papers lag the warehouse by about two years, in our experience, which is why we plan inventory from order flow and treat forecasts as commentary.
Frequently Asked Questions
Is renewable energy really cheaper than fossil fuels now?
For new generation, yes in most of the world. Levelized cost analyses put utility-scale solar and onshore wind at roughly $0.03–0.05/kWh, below new gas generation and below the operating cost alone of many existing coal plants.
How much CO₂ does solar actually save?
Lifecycle solar PV emissions run 20–50 g CO₂/kWh versus 410–520 for natural gas and 820–1,200 for coal. A typical 8kW home array avoids roughly 4–8 metric tons of CO₂ per year depending on the local grid mix.
What happens when the sun isn't shining or wind isn't blowing?
Three tools: geographic diversity (the wind is always blowing somewhere), storage (batteries shift hours, hydro shifts days), and firm clean sources like geothermal and biomass. Grid operators already manage this daily at renewable shares that were considered impossible a decade ago.
Do solar panels work in cold or cloudy climates?
Yes — panels are slightly more efficient in cold temperatures, and diffuse light still produces power. Germany, hardly a sunbelt nation, generates over half its electricity from renewables. Output is lower than in Arizona; viability depends on local electricity prices, not just sun hours.
How long do renewable energy systems last?
Solar panels carry 25-year warranties and typically produce 84–88% of rated output at year 25 (0.4–0.55% annual degradation). Wind turbines run 20–30 years; hydro plants exceed 50. Inverters are the wear item — plan on one replacement in a solar system's life.
What's the fastest way to start using green energy at home?
Size a system from your annual kWh usage, verify roof condition and sun exposure, then choose grid-tied or hybrid-with-battery based on your utility's net metering. Complete kits and a sizing calculator shortcut most of the homework.
Related Resources
- Off-grid cabin kits — complete renewable power for remote properties
The global picture and the household decision turn out to be the same story told at two scales: clean energy that pays for itself, hardens its owner against disruption, and compounds its advantages every year it operates. The technology arrived, the economics followed, and the equipment is sitting in warehouses ready to ship. What's left is deployment — one roof, one facility, one project at a time, multiplied by everyone who stops waiting for a better moment that already came.
Renewable Energy and Electrification: The Convergence
The energy transition is not just about replacing coal plants with solar farms. It's about electrifying everything that currently burns fuel — heating, transportation, industrial process heat — and powering that electrification with clean generation. This convergence changes the math for homeowners, businesses, and utilities alike.
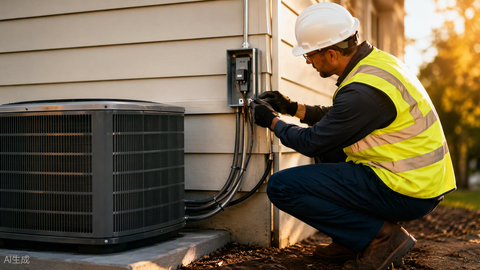
A residential heat pump replaces a gas furnace and an air conditioner in one unit, cutting heating energy use by 40–60% and eliminating on-site combustion. An electric vehicle replaces gasoline with grid electricity, and if that electricity is solar, the carbon reduction is near-total. An induction cooktop replaces a gas range, improving indoor air quality and removing a methane leak source from the kitchen. Each of these electrification steps increases electricity demand — which sounds like a problem, but is actually an opportunity if the new demand is flexible and timed to coincide with cheap renewable generation.
| Electrification Switch | Fuel Replaced | Annual Energy Savings | Carbon Reduction (if solar-powered) |
|---|---|---|---|
| Heat pump (vs. gas furnace) | Natural gas | 40–60% less source energy | ~2–4 metric tons CO₂/yr |
| EV (vs. 25 MPG gas car) | Gasoline | ~$1,000–1,500/yr at $0.13/kWh | ~3–5 metric tons CO₂/yr |
| Heat pump water heater (vs. gas) | Natural gas | 60–70% less electricity than resistance | ~1–2 metric tons CO₂/yr |
| Induction cooktop (vs. gas range) | Natural gas | ~10–15% less cooking energy | ~0.3–0.5 metric tons CO₂/yr |
| Solar + battery + EV + heat pump | All fossil fuels | Net-zero energy cost over 20 yrs | ~8–15 metric tons CO₂/yr |
The table above is approximate — actual savings depend on local climate, driving patterns, utility rates, and system sizing. But the pattern is clear: electrification plus renewable generation plus storage creates a system where the home produces more clean energy than it consumes, and the excess charges the car. We've designed systems for customers who went from $3,500/year in combined utility and gasoline bills to net-zero with a 10 kW solar array, a heat pump, and an EV. The payback is 8–12 years in most markets, and the system keeps saving money for another 15 years after that.
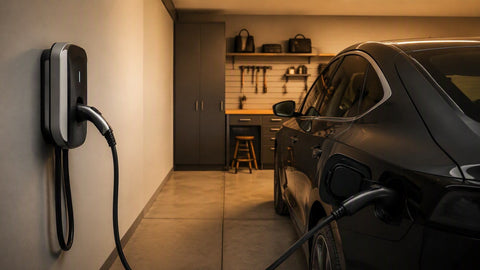
The utility perspective is different but converging. Electrification increases total electricity demand, which helps amortize fixed grid costs and justifies new transmission investment. But it also creates new peak demands — winter evenings when heat pumps and EV chargers run simultaneously — that the current grid was not built for. The solution is demand flexibility: time-of-use rates, smart EV chargers that charge when solar is abundant, and thermal storage in water heaters that pre-heats during the day. Our EV charger catalog includes smart units with scheduled charging, and our battery sizing guide covers load-shifting strategies.
The Honest Limits of Renewable Energy
No serious guide ends without acknowledging the boundaries. Renewable energy is not infinite, free, or without impact. Manufacturing solar panels consumes energy, water, and critical minerals — silicon, silver, copper, aluminum. Wind turbines require rare-earth magnets, concrete foundations, and composite blades that are difficult to recycle. Battery production relies on lithium, cobalt, and nickel, with supply chains concentrated in a handful of countries. These are real constraints, not talking points.
The response is not to abandon renewables but to manage the supply chain honestly. Recycling capacity for lithium-ion batteries is scaling rapidly; by the early 2030s, recycled materials could supply a significant share of new battery production. Solar panel recycling is following a similar curve — the EU's WEEE directive already mandates take-back, and dedicated PV recycling facilities are opening in the US. Material substitution reduces dependence: LFP batteries eliminated cobalt from a huge segment of the market; sodium-ion batteries are entering commercial production without lithium entirely. The fossil system, it's worth noting, has the same supply-chain problem every single day, just at the fuel dock rather than the factory.
Land use is another honest constraint. A utility-scale solar farm needs roughly 5–8 acres per MW. Powering the entire US with solar alone would require on the order of 0.5–1% of the country's land area — less than the footprint of golf courses, and a fraction of the land already disturbed by fossil extraction. But 0.5% of the US is still a lot of land, and siting requires community acceptance, transmission access, and environmental review. Agrivoltaics — elevated solar arrays over grazing or shade-tolerant crops — and rooftop-first policies shrink the number further. Our commercial solar guide covers siting considerations in detail.