In 2024, for the first time in history, solar photovoltaic generation in the United States produced more electricity than natural gas over a trailing 12-month period. The margin was narrow — solar at 83.1 terawatt-hours versus natural gas at 81.6 TWh in the California ISO territory alone — but the direction is not. Solar is now the fastest-growing source of electricity on earth, the cheapest source of new generation in most markets, and the technology that utilities, regulators, and investors are betting the next decade on. This guide explains how solar got to this point, what the generation numbers actually say, where natural gas still matters, and what the shift means for anyone buying, installing, or investing in power systems today.

The Milestone: Solar Edges Past Natural Gas
The crossover happened in stages, not all at once. In California, the nation's largest state economy and the grid with the highest solar penetration, utility-scale solar plus small-scale rooftop solar together generated 83.1 TWh in the most recent 12-month reporting period tracked by the California Energy Commission. Natural gas-fired generation in the same period produced 81.6 TWh. That 1.5 TWh gap is roughly equal to the output of two large combined-cycle gas plants running flat out for a year — statistically small, symbolically enormous.
The national picture is more nuanced. Across the entire United States, natural gas still supplies roughly 40% of electricity generation, while solar sits at roughly 4–5% on a nationwide basis. But national aggregates hide the trajectory. Solar is growing at 15–25% annually by capacity; gas is flat or declining in generation share even as gas-fired capacity grows, because the new gas plants run fewer hours as cheap solar and wind push them down the dispatch order. The marginal kilowatt-hour — the next electron needed when demand rises — is increasingly solar during daylight hours and wind or gas at night. Over time, storage and transmission erode even gas's nighttime role.
We've watched this transition from the supply side for two decades. In 2008, a 5 kW residential system was a $35,000 luxury purchase. In 2025, a comparable system costs $12,000–$18,000 before incentives, and the modules are more efficient, more durable, and backed by 25-year warranties. The cost collapse is the engine behind the generation numbers, and it's not finished.
Generation Mix: How the Numbers Break Down
| Energy Source | U.S. Share (2024, approx) | Annual Growth Trend | Key Driver |
|---|---|---|---|
| Natural Gas | ~40% | Flat to slightly declining | Existing fleet; fewer running hours due to cheap renewables |
| Coal | ~16% | Declining ~5–8% annually | Retirements; economics favor gas and renewables |
| Nuclear | ~18% | Flat | Zero-carbon baseload; few new builds, some extensions |
| Solar (Utility + Rooftop) | ~4–5% | Growing ~15–25% annually | Cost collapse, policy support, distributed generation |
| Wind | ~10% | Growing ~5–10% annually | Mature technology, good resource areas, offshore expansion |
| Hydroelectric | ~6% | Flat | Mature resource; limited new large-dam construction |
| Other (biomass, geothermal, oil) | ~5% | Flat to slightly growing | Geothermal and biomass as firming resources |
The table above is approximate — EIA and ISO data lag by months, and regional variations are enormous. Texas generates more wind power than many countries. California generates more solar than many countries. West Virginia still runs on coal. But the national trend is clear: coal is exiting, gas is plateauing, nuclear is holding, and solar plus wind are the growth story. By 2030, most analysts expect solar to pass 10% of U.S. generation, with wind near 15%. The question is not whether solar grows, but how fast transmission, storage, and interconnection can keep up.
Why Solar Won on Cost
The levelized cost of energy (LCOE) for utility-scale solar has fallen roughly 90% since 2010, from over $0.35/kWh to $0.03–0.06/kWh in sunny regions. Wind followed a similar curve. Natural gas, meanwhile, has seen its fuel cost swing with global commodity markets — from $2/MMBTU in 2020 to over $9/MMBTU in 2022 after Russia's invasion of Ukraine. The contrast is structural: solar's cost is almost entirely upfront capital; once built, the fuel is free forever. Gas's cost is split between capital and fuel, and the fuel price is outside anyone's control.
| Technology | Capital Cost ($/kW) | Fuel Cost ($/kWh) | LCOE (new build, 2024) | Cost Trend |
|---|---|---|---|---|
| Utility Solar (single-axis tracking) | $800–1,200 | $0 | $0.03–0.06 | Still falling |
| Onshore Wind | $1,200–1,800 | $0 | $0.03–0.05 | Slowly falling |
| Natural Gas Combined Cycle | $800–1,200 | $0.03–0.07 (variable) | $0.04–0.10 | Rising with fuel price |
| Coal | $2,500–4,000 | $0.02–0.04 | $0.06–0.15 | Rising (retirement economics) |
| Nuclear (new build) | $6,000–10,000+ | $0.005–0.01 | $0.08–0.15+ | Flat; Vogtle overruns raised costs |
The LCOE comparison above is for new-build generation, which is the relevant metric for investment decisions. An existing gas plant that is already paid for can produce power at $0.03–0.05/kWh depending on fuel price, which is why gas isn't disappearing overnight. But when a utility needs new capacity — either to replace retiring coal or to meet growing demand — solar is now the default choice in most U.S. markets. The exceptions are regions with poor solar resource (Pacific Northwest, northern New England) or constrained land (dense urban cores), where wind, gas, or imported power fill the gap.
From a distributor's perspective, the cost collapse shows up in order flow. Five years ago, our commercial solar quotes were dominated by 300W poly modules at $0.35/W. Today, the standard is 550W+ monocrystalline TOPCon modules at $0.12–0.18/W. Each doubling of module wattage cuts racking, wiring, and labor per watt, which is why installed costs keep falling even when module prices plateau. Our commercial solar cost breakdown tracks these numbers in detail.
Where Natural Gas Still Dominates — and Why
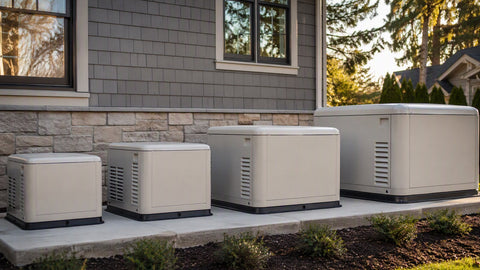
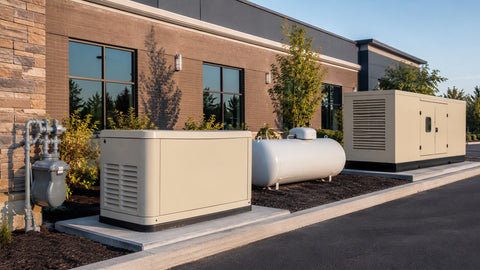
Solar's weakness is intermittency. The sun sets. Clouds pass. Seasonal output in the northern United States can vary by 3:1 between June and December. Natural gas's great strength is dispatchability: a combined-cycle plant can ramp from 50% to 100% load in minutes, and a simple-cycle peaker can start from cold in 10–15 minutes. Until storage is cheap enough and widespread enough to shift solar generation across the daily and seasonal cycle, gas provides the firming that keeps the lights on.
| Factor | Solar PV | Natural Gas |
|---|---|---|
| Availability | Daylight hours only; varies by season and weather | 24/7, weather-independent |
| Dispatchability | Non-dispatchable (must be used when generated or stored) | Fully dispatchable; ramp rate 5–10% per minute (CCGT) |
| Capacity factor | 15–30% (location-dependent) | 40–60% (CCGT); 5–15% (peakers) |
| Startup time | Instant (when sun hits panel) | 10–30 min (peaker); 1–4 hours (CCGT cold start) |
| Emissions | Zero operational; 20–50 g CO₂/kWh lifecycle | 410–520 g CO₂/kWh; methane leakage adds warming |
| Land use | ~5–8 acres per MW | ~1 acre per MW (plant footprint) |
| Water use | Near zero (panel cleaning only) | 150–300 gal/MWh (cooling) |
The capacity factor row is the one most people misunderstand. A 100 MW solar farm in Arizona with a 28% capacity factor produces about 245,000 MWh per year. A 100 MW combined-cycle gas plant with a 50% capacity factor produces about 438,000 MWh per year. To replace the gas plant's annual output with solar requires roughly 180 MW of solar nameplate — plus storage if the replacement is meant to be 24/7. The solar output is cheaper per MWh, but you need more megawatts of hardware to match the gas plant's annual generation. This is why "solar surpassed natural gas" in California's specific mix does not mean solar can replace gas everywhere, immediately.
Gas also provides grid services that solar panels cannot: inertia, voltage regulation, and black-start capability. A spinning gas turbine has physical rotational inertia that resists frequency deviations; solar inverters have no moving parts and must synthesize grid stability through software. Grid-forming inverters — the next generation of solar and battery control — can replicate some of these services, but deployment is early and standards are still evolving. For the next decade, gas and solar are not enemies; they are partners in a transition where gas provides firming and solar provides cheap daytime electrons.
State-by-State Solar Adoption: Who's Leading

| State | Solar Share of Generation (2024, approx) | Key Policy Driver | Notable Constraint |
|---|---|---|---|
| California | ~28% | Net metering, RPS mandates, SGIP storage incentives | Duck curve; evening ramp strain; interconnection queues |
| Hawaii | ~18% | High retail rates ($0.30–0.40/kWh); solar mandate | Grid stability; limited inter-island transmission |
| Nevada | ~17% | Excellent solar resource; utility-scale buildout | Water scarcity; transmission to load centers |
| Arizona | ~10% | High insolation; utility programs | Summer peak demand exceeds solar + storage |
| Texas | ~6% | ERCOT market design; competitive pricing; land availability | Transmission constraints; winter storm risk |
| Florida | ~5% | Rising demand; utility-scale solar farms | Hurricane risk; limited rooftop policy support |
| New York | ~4% | CLCPA mandates; offshore wind complement | High installation costs; limited land |
| National Average | ~4–5% | ITC, state RPS, falling costs | Interconnection, permitting, NIMBYism |
California's 28% solar share is the benchmark, but it's also a warning. The famous "duck curve" — a net-load profile that plunges at midday when solar floods the grid and then spikes in the evening as solar fades — forces rapid ramping of gas plants or massive battery deployment. In 2024, California routinely curtailed mid-day solar because there was more generation than load plus export capacity. The solution is storage: California has installed over 10 GW of battery storage, the most of any state, to shift solar generation into the evening peak. Our battery sizing guide covers the math for residential systems; grid-scale storage follows the same physics at terawatt-hour scale.
The Role of Battery Storage in the Solar Transition
Solar surpassing gas in annual generation is a headline. The more important story is what happens when solar is paired with storage. A solar panel without a battery produces power when the sun shines and wastes what isn't used. A solar panel with a battery becomes dispatchable: store the midday surplus, discharge it at 6 p.m. when demand peaks and gas plants would otherwise fire. The economics of this pairing have changed dramatically.
In 2018, utility-scale lithium-ion battery storage cost roughly $600/kWh of capacity. In 2024, it's under $200/kWh and falling. At $150/kWh, a 4-hour storage system — enough to shift solar from noon to evening — adds roughly $600/kW to a solar project's cost. Combined with solar at $800–1,000/kW, the total is $1,400–1,600/kW for a resource that produces during the day and delivers into the evening peak. That combination is now competitive with new gas peakers in many markets, and it emits no operational carbon.
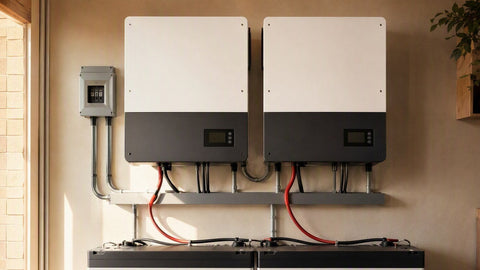
For homeowners, the same logic applies at a smaller scale. A battery storage system paired with rooftop solar provides backup during outages, shifts self-consumption to maximize value under time-of-use rates, and reduces grid dependence. The federal investment tax credit now covers both solar and storage, and some states add rebates on top. Our home battery bank sizing guide runs the numbers for residential systems.
Global Context: Solar's Rise Is Not Just American
The United States is not the solar leader in per-capita terms. Australia generates more solar per person than any major economy. The Netherlands, despite its latitude, has aggressive rooftop deployment. China builds more solar capacity in a single year than the entire U.S. installed base. In 2024, global solar installations exceeded 400 GW of new capacity — roughly equal to the entire installed capacity of Germany, multiplied by four.
What makes the U.S. milestone notable is scale. The American grid is the world's largest integrated power system, and solar's penetration here signals that the technology works at the highest levels of complexity. If solar can supply 28% of California's electricity — a grid serving 39 million people with a $3.6 trillion economy — it can supply significant shares of almost any grid on earth. The remaining questions are not technical; they are administrative: permitting speed, interconnection queues, workforce training, and supply chain diversification.
What This Means for Buyers and Installers
For a homeowner or business considering solar today, the solar-surpasses-gas headline is background noise. The actionable facts are these: solar equipment is cheaper than ever, incentives are still available, and the technology is mature. The decision is not whether solar works — it clearly does — but whether your specific roof, load profile, and utility rate structure make it economical.
Key questions to ask:
- What is your all-in cost per watt installed? In 2025, $2.50–$3.50/W is typical for residential before incentives; $1.00–$1.50/W for utility-scale. If a quote is significantly higher, ask why.
- What is your net metering or export compensation rate? Solar economics depend heavily on what the utility pays for excess generation. Markets with strong net metering (full retail credit) favor solar strongly; markets with minimal compensation favor adding storage.
- Does your roof have 20+ years of life left? Solar panels last 25–30 years. Removing and reinstalling them to replace a roof costs $0.50–$1.00/W — factor this into the decision.
- What is your time-of-use rate structure? If your utility charges $0.08/kWh at noon and $0.35/kWh at 6 p.m., solar plus battery is dramatically more valuable than solar alone.
For installers and contractors, the growth curve means volume — but also pressure. Interconnection queues in some regions stretch to 3–5 years. Permitting remains a patchwork of local jurisdictions, each with its own requirements. And the workforce shortage is real: the U.S. needs tens of thousands of additional electricians and solar installers to meet state and federal deployment targets. Our racking systems guide and commercial cost breakdown are resources we maintain specifically to help contractors bid accurately and install efficiently.
How to Read an Electricity Generation Report
Industry data can be misleading if you don't know what the columns mean. Here's how we read generation reports when advising customers:
- Distinguish capacity from generation. A 100 MW solar farm is not the same as a 100 MW gas plant. Capacity is nameplate maximum output; generation is actual energy produced over time, measured in MWh or TWh. Always compare generation, not capacity, when evaluating market share.
- Check whether "solar" includes distributed generation. Some reports count only utility-scale solar (>1 MW). Others include rooftop and small commercial. California's 28% figure includes both; national EIA data often separates them.
- Look at the time resolution. Annual generation data smooths over daily and seasonal variation. A grid that is 20% solar annually may be 60% solar at noon in June and 0% solar at midnight in December. The system must be designed for the worst hour, not the average year.
- Account for curtailment. When solar output exceeds demand plus export capacity, grid operators curtail (shut down) solar farms. Curtailed solar is not wasted sunlight — the panels keep producing, but the inverters are commanded offline. High curtailment is a sign of grid congestion, not solar failure.
- Compare against retail rates, not wholesale. Rooftop solar competes against the retail electricity rate you pay ($0.12–0.30/kWh), not the wholesale generation cost ($0.03–0.06/kWh). This is why rooftop solar economics work even when utility-scale solar is cheaper on a raw $/MWh basis.
Understanding these distinctions prevents the common error of comparing apples to oranges — a solar nameplate watt against a gas nameplate watt, or a wholesale LCOE against a retail electric bill.
Frequently Asked Questions
Has solar really surpassed natural gas nationally?
Not yet on a nationwide annual basis. Natural gas still supplies roughly 40% of U.S. electricity versus solar at 4–5%. However, solar has surpassed natural gas in specific states (California, Nevada, Hawaii) and in new capacity additions. The trend line points to solar passing gas in total generation within the next decade if current growth rates continue.
Why did solar overtake natural gas in California first?
California has the nation's strongest renewable portfolio standard, excellent solar resource, high retail electricity rates that make rooftop solar attractive, and aggressive utility-scale procurement. The state also has the largest battery storage fleet, which absorbs midday solar and shifts it to evening demand.
Can solar power the entire grid without natural gas?
Not with today's technology and infrastructure. Solar is intermittent and needs firming resources — currently natural gas, hydro, nuclear, and increasingly batteries — to provide power when the sun isn't shining. Long-duration storage, advanced nuclear, green hydrogen, or enhanced geothermal could reduce or eliminate gas dependence over decades, but not overnight.
What happens to natural gas plants as solar grows?
Most gas plants will run fewer hours per year as solar and wind push them down the dispatch order, but they will remain online for reliability and peak demand. Some older, less efficient plants will retire. New gas plant construction has slowed significantly because solar-plus-storage is now cheaper for new capacity in most markets.
Is solar still worth installing if my utility has weak net metering?
Yes, but the economics change. With weak net metering, self-consumption becomes critical — size the system to match your daytime load, and add battery storage to shift excess generation to evening hours. In some markets, a smaller solar-plus-battery system has better ROI than a larger solar-only system.
How much CO₂ does solar actually save versus natural gas?
Lifecycle analysis puts solar PV at 20–50 g CO₂/kWh versus 410–520 g for natural gas combined cycle. Over a 25-year system life, an 8 kW residential array avoids roughly 100–200 metric tons of CO₂ compared to gas-heavy grid generation — the equivalent of taking 20–40 cars off the road for a year each.
Does solar work in cold or cloudy climates?
Yes. Solar panels are more efficient in cold temperatures, and diffuse light still generates power. Germany, which receives roughly half the annual sun hours of California, generates over 50% of its electricity from renewables. Output is lower; viability depends on local electricity prices and incentives as much as solar resource.
What is the duck curve?
The duck curve is a net-load profile showing high evening demand and low midday demand on grids with high solar penetration. As solar floods the grid at noon, net demand drops; as solar fades in the evening, net demand ramps up sharply, requiring fast-ramping gas plants or storage. California's duck curve is the most famous example.
Related Products & Resources
- 400–459W solar panels
- 550–709W solar panels
- Complete solar kits
- Battery storage
- Solar panel kits buyer's guide
- Solar system size calculator
- Home battery bank sizing guide
- Solar battery sizing guide
- Commercial solar installation costs
- Can solar panels power a whole house?
- Solar panel racking systems guide
- Off-grid cabin kits
- Hybrid inverter overview
Solar surpassing natural gas in any jurisdiction is a milestone, not a finish line. The technology has won on cost; the remaining work is logistics — interconnection queues, permitting reform, workforce development, and the buildout of storage and transmission that lets solar serve load around the clock. From a supplier's perspective, the trend is unambiguous: every month we ship more modules, more inverters, and more batteries than the month before. The equipment is ready. The economics are proven. What's left is the unglamorous work of building the projects, one roof and one substation at a time, until the headline about solar surpassing gas applies to the entire country, not just to California on a sunny afternoon.