Last Updated: 2026 • Project figures as announced by Panasonic; economics examples are illustrative and marked as such

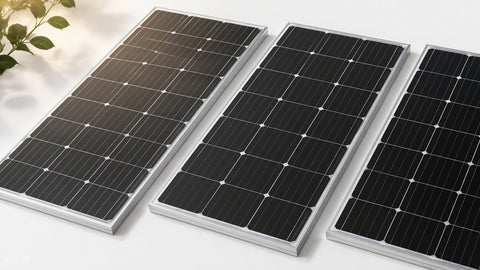
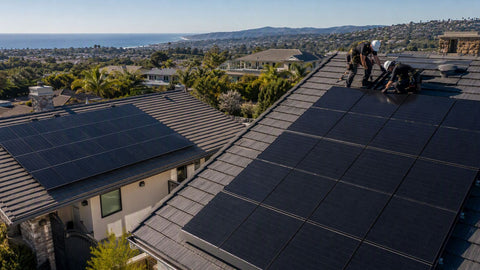
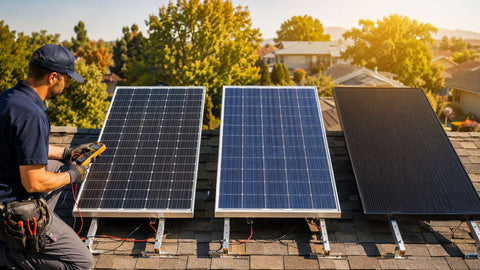
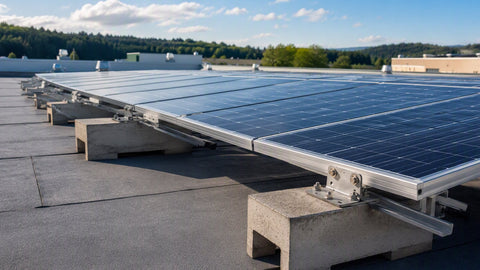
When Panasonic commissioned the largest photovoltaic installation in its corporate history — 9,461 solar panels projected to generate roughly 5,900 MWh of clean energy per year and cut an estimated 3,912 tons of CO₂ annually — it did more than put panels on a roof. It demonstrated what a megawatt-class corporate solar commitment looks like when it's engineered as core infrastructure rather than a sustainability press release.
We supply commercial and industrial solar projects for a living, and we study installations like this one for a simple reason: the engineering decisions that make a 9,000-panel corporate array work are the same decisions that make a 400-panel warehouse array work, just scaled. This article breaks the Panasonic project down as a case study — the numbers, the technology, the environmental math — and then turns it into a replication playbook for facility managers, business owners, and developers planning their own largest-yet photovoltaic system.
⚡ Quick Answer
Panasonic's largest Group photovoltaic installation deploys 9,461 panels, generates approximately 5,900 MWh/year, and avoids an estimated 3,912 tons of CO₂ annually — equivalent to taking roughly 850 gasoline cars off the road. Working backward from the production figure, the system implies a DC capacity near 3.9 MW and a capacity factor around 17%, consistent with modern ~400W-class commercial modules. For businesses, the project is a template: on-site generation at megawatt scale cuts operating cost, hedges tariff exposure, and delivers verifiable emissions reductions.
Press-release figures only become engineering insight when you check the arithmetic. Here's the Panasonic installation decomposed — announced figures in plain type, derived estimates marked:
| Metric | Value | How It Checks Out |
|---|---|---|
| Panel count | 9,461 modules | Announced figure |
| Annual generation | ~5,900 MWh/year | Announced projection |
| Implied DC capacity (est.) | ~3.9 MW | 9,461 modules × ~410W class ≈ 3.88 MW — consistent with modern commercial modules |
| Implied capacity factor (est.) | ~17% | 5,900 MWh ÷ (3.88 MW × 8,760 h) ≈ 17.4% — a healthy fixed-tilt figure |
| Annual CO₂ avoidance | ~3,912 metric tons | Announced; implies ~0.66 t/MWh grid displacement — consistent with a fossil-heavy regional grid |
| Car equivalence (est.) | ~850 passenger vehicles/year | Using EPA's ~4.6 t CO₂ per car-year equivalence |
Two of those derived numbers deserve attention. The ~17% capacity factor tells you this system sits in decent-but-not-desert irradiance and is engineered sensibly — no heroic assumptions. And the 0.66 tons-per-MWh displacement rate is a reminder that solar's carbon value is a property of the grid it displaces: the same megawatt-hour avoids twice as much CO₂ on a coal-heavy grid as on a hydro-heavy one. When businesses claim emissions reductions, that grid factor is where the honesty lives. It's also worth noting what the numbers don't claim: this is generation math, not a promise about Panasonic's total corporate footprint — one array, however large, is a line item in a sustainability program, not the program itself.
Panasonic's solar pedigree runs deep — its HIT (heterojunction with intrinsic thin layer) cells were among the most efficient mass-produced modules of their era, prized for a temperature coefficient around −0.26%/°C that outperformed standard crystalline in hot conditions. One honest industry note for context: Panasonic exited in-house PV module manufacturing in 2022, and its EverVolt-branded residential line has continued through partner manufacturing — a reminder that even the strongest solar brands evolve their supply chains. (Current EverVolt-class product we stock includes the EVPV370 and EVPV410 modules.)
An installation at this scale succeeds or fails on system-level engineering more than module brand:
Logistics deserve a mention of their own. Nine thousand four hundred sixty-one panels is roughly 430 pallets, on the order of fifteen to twenty truckloads of modules alone — before racking, inverters, and wire. Staging, crane picks, and just-in-time delivery sequencing against roof readiness are projects inside the project. This is the part of megawatt-class work that never makes the press release and consumes a full-time logistics coordinator for months. We've coordinated deliveries at this scale and the rule holds: the array is only as fast as the loading dock.
- Module efficiency under real conditions. High-efficiency modules matter most where roof area is the constraint — more watts per square meter of structural capacity.
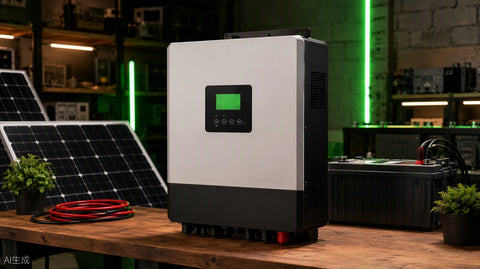
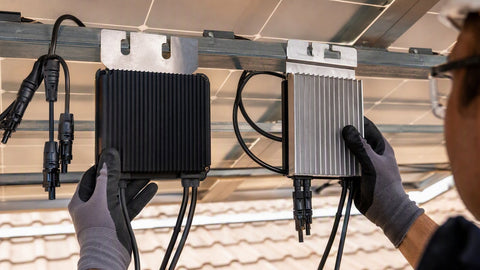
- Inverter architecture. Megawatt-class roofs typically split across multiple string inverters or central units with string-level monitoring, so a single fault costs a sub-array, not the plant.
- Monitoring and energy management. Real-time production telemetry against a weather-adjusted model is how a 5,900 MWh projection stays a 5,900 MWh reality — underperformance gets caught in days, not discovered at the annual review.
- Structural and electrical integration. Ballasted or attached racking engineered to the roof's load capacity, with DC collection designed for code-compliant rapid shutdown and maintainable wire management.
The environmental story writes the headline; the operating economics get the project approved. Here's an illustrative pro forma for a US facility replicating the Panasonic approach at similar scale — all figures rounded, illustrative, and market-dependent:
| Line Item | Illustrative Value | Basis |
|---|---|---|
| System size | 3.9 MW DC | Matched to case-study scale |
| Annual production | ~5,900 MWh | ~1,510 kWh/kW-year |
| Installed cost | ~$4.3M | ~$1.10/W commercial-class pricing |
| Net cost after 30% ITC | ~$3.0M | Section 48 credit; bonuses possible (domestic content, energy community) |
| Annual energy value | ~$700K/year | 5,900 MWh × $0.12/kWh blended retail offset |
| Simple payback | ~4.3 years | Net cost ÷ annual value, before escalation and O&M |
| 25-year nominal value | ~$17M+ | Flat-rate approximation; retail escalation improves it |
That payback row is why corporate solar survived every policy swing of the last decade: a four-to-five-year simple payback on infrastructure with a 30-year service life is a financeable decision in almost any boardroom. Stack bonus credits where the site qualifies — domestic content alone adds ten ITC points — and the math improves further. Our solar ROI calculator runs this same arithmetic on your own tariff and roof, and the safe-harbor guide covers the commence-construction rules that protect credit eligibility while you engineer.
Two caveats belong on any pro forma like this. First, energy value is tariff-specific: a facility on a flat industrial rate and one on a demand-heavy commercial tariff will value the same 5,900 MWh very differently, and interval-data analysis is the only honest way to price it. Second, incentives move — the 2026 policy landscape already looks different from 2022's, which is precisely why projects with disciplined safe-harbor timing survived and projects that assumed permanence got surprised. Model conservatively, lock what's lockable, and let the upside be upside.
The announced 3,912-ton annual CO₂ reduction compounds quietly into the most impressive number in the project: over a 30-year service life, this single installation avoids on the order of 117,000 tons of CO₂ — before counting degradation, which trims a few percent, or grid decarbonization, which trims the displacement rate over time. Counted conservatively, it's still six figures of avoided tonnage from one roof.
| Equivalence | Annual (3,912 t CO₂) | 30-Year Cumulative (~117,000 t) |
|---|---|---|
| Passenger cars removed (4.6 t/car-yr) | ~850 cars | Equivalent of ~25,000 car-years |
| US homes' electricity (≈7.5 t/home-yr, energy use) | ~520 homes | ~15,600 home-years |
| Clean energy delivered | 5,900 MWh | ~177,000 MWh |
Beyond carbon, on-site generation trims demand charges and peak-period grid draw — the quiet grid benefit of thousands of distributed megawatt-class rooftops is that they shave the afternoon peaks the dirtiest peaker plants exist to serve. One roof is a project. A thousand roofs is infrastructure.
There's also a land-use virtue that doesn't fit in a carbon table: rooftop and facility-sited solar generates on already-disturbed land. No new transmission corridors through habitat, no greenfield grading, no water for cooling. For companies with serious sustainability audits, the siting footprint of on-site generation is part of the environmental ledger — and it's a ledger where rooftop megawatts are nearly pure gain. The electrons show up where the load already lives, which is the most efficient transmission plan ever devised: none at all.
Replicating the Model: A Facility Manager's Playbook

The distance between Panasonic's 9,461 panels and your facility's project is process, not mystery. The sequence we walk commercial customers through:
- Pull twelve months of interval data. Your utility's 15-minute load data decides system size, demand-charge value, and whether storage pencils. Guesses here cost six figures later.
- Assess the roof honestly. Age, remaining warranty, structural capacity, and membrane condition. A roof with eight years left gets re-roofed with the solar project, not after it leaks under 400 ballasted racks.
- Screen interconnection early. Utility capacity at your service point is a gating item; on constrained feeders it can decide the project. The queue landscape is covered in our interconnection backlog analysis.
- Lock the tax strategy before procurement. ITC rate, bonus eligibility, and safe-harbor timing all shape when you should sign the equipment order — and domestic-content-capable BOMs like the ones in our commercial panels category can add ten points.
- Spec for the 30-year case. Modules with documented degradation rates, string inverters with fleet monitoring, PV wire and connectors that carry their ratings on the jacket. Cheap BOS is expensive BOS by year twelve.
- Contract monitoring and O&M from day one. The 5,900 MWh projection only pays if someone is watching the actuals.
From our side of the counter: the commercial projects that go smoothest are the ones where the facility team calls their distributor at step 1, not step 5. When we see the load data early, we can flag the interconnection and transformer lead-time issues while they're still schedule details instead of change orders. That's what the project quote process is built for.
The next chapter for installations like Panasonic's is already being written: megawatt-class corporate arrays are evolving from pure offset generators into grid-interactive assets. Pair the array with storage and the facility can firm its own peak draw, ride through grid events, and participate in demand-response or virtual power plant programs that pay for flexibility. The battery side of that equation is where corporate energy strategy is heading fastest — the same LFP platforms that dominate residential storage, scaled into cabinet and container systems, turn a fixed generation profile into a dispatchable one.
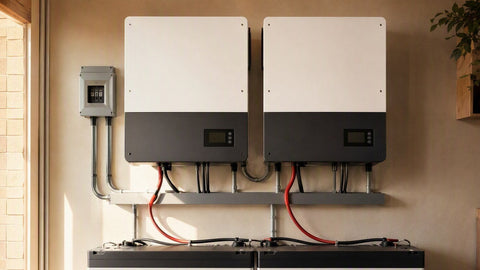
For facilities evaluating that path, the design questions shift: inverter architecture becomes hybrid or AC-coupled storage-ready, interconnection agreements get negotiated with export limits or non-export provisions, and the energy management system becomes the brain that decides every minute whether to serve load, charge, or discharge. Our energy storage category covers the equipment side, and the battery buyer's guide walks the architecture decision.
Watch for more corporate announcements structured exactly this way — array plus storage plus smart controls — because the economics of flexibility are compounding faster than the economics of generation alone. Panasonic built the generation chapter well. The storage chapter is where the next 3,912 tons come from.
Not every reader is engineering four megawatts. The same physics and discipline scale down to a 400-panel warehouse or a 20-panel home, and the translation looks like this:
- Production modeling honesty scales down. Panasonic's ~17% implied capacity factor is what realistic modeling looks like. If a residential proposal for your zip code promises 1,800+ kWh per kW-year on a fixed roof, ask what assumptions produced it — shading, orientation, and weather files are where optimistic quotes hide.
- Monitoring scales down. A 9,461-panel array needs fleet telemetry; a 20-panel array needs module- or string-level monitoring for the same reason: silent underperformance is the most expensive fault in solar, and it compounds daily until someone looks.
- Structural honesty scales down. Corporate projects engineer the roof; residential projects should too — a structural look at rafter condition and a frank conversation about remaining roof life before the racking goes on.
- The carbon ledger scales down. A 10 kW home array producing ~13,000 kWh/year on an average US grid avoids roughly 5 tons of CO₂ annually — one car's worth, from one roof, every year, for three decades.
And one lesson scales up from the residential side that corporate projects increasingly borrow: distributed beats monolithic for resilience. Panasonic's array is one large system, but the industry's direction — thousands of facility-scale systems plus millions of rooftops, increasingly paired with storage — builds a grid that's harder to knock out than any central plant. Every facility that replicates this playbook makes the whole system more durable.
Panasonic's installation is one node in a broad corporate shift. The drivers stacking up behind megawatt-class on-site solar:
| Driver | Mechanism | Who Feels It Most |
|---|---|---|
| Retail rate escalation | Grid tariffs compound while solar's marginal cost of energy is zero | Energy-intensive manufacturing, cold storage, data-adjacent facilities |
| Demand charges | Solar shaves coincident peaks; solar-plus-storage shaves them harder | Facilities with peaky afternoon loads |
| Scope 2 commitments | On-site generation delivers verifiable, audit-ready emissions reductions | Public companies with published net-zero targets |
| Federal incentives | 30% ITC base, stackable to 50% with domestic content and energy community bonuses | Any tax-paying owner; direct pay covers non-profits and public entities |
| Resilience economics | Generation plus storage keeps revenue-critical operations running through outages | Cold chain, healthcare-adjacent, continuous-process industry |
We've quoted into this shift directly: five years ago, the commercial calls we got were mostly "what would solar cost?" Today they're "here's our interval data and our roof report — what can you have on site by Q4?" The conversation moved from curiosity to procurement, and installations like Panasonic's are what moved it. Nothing sells a boardroom like a peer company's meter spinning backwards.
Three signals from a 9,461-panel commitment by a company with Panasonic's engineering culture. First, corporate solar has outgrown the pilot phase — this is not a demonstration array on the HQ front lawn; it's production-scale generation sized against real facility load. Second, the module supply chain is global and fluid: Panasonic's own exit from in-house module manufacturing in 2022, with EverVolt continuing through partners, shows that even legacy solar brands now buy like customers — which puts distributors with deep multi-brand catalogs in the middle of every serious project. Third, monitoring is the product: at this scale, the telemetry stack that keeps 5,900 MWh on schedule is as engineered as the array itself, and corporate buyers increasingly spec the monitoring before they spec the modules.
For the residential and small-commercial market, the trickle-down is real: the string-inverter reliability, module-level monitoring, and BOS discipline proven at megawatt scale show up in the equipment we sell for 10 kW rooftops. The same Tier 1 modules and inverter platforms that anchor corporate arrays are sitting in our Louisville warehouse in residential quantities.
The throughline across every section of this case study is discipline: realistic production modeling, honest carbon math, logistics treated as engineering, and monitoring treated as infrastructure. That's what makes Panasonic's largest photovoltaic system worth studying — not the superlative, but the competence underneath it. Facilities that copy the discipline will get their own version of the headline.
How big is Panasonic's largest photovoltaic system?
The installation deploys 9,461 solar panels and is projected to generate approximately 5,900 MWh of clean energy per year. Working backward from production, that implies a DC capacity near 3.9 MW and a healthy ~17% capacity factor — megawatt-class corporate solar engineered as core facility infrastructure.
How much CO₂ does the Panasonic solar project avoid?
An estimated 3,912 metric tons of CO₂ per year — roughly equivalent to removing 850 gasoline passenger cars from the road, using EPA's ~4.6-ton-per-car equivalence. Over a 30-year service life, cumulative avoidance is on the order of 117,000 tons, before degradation and grid-decarbonization adjustments.
Does Panasonic still make solar panels?
Panasonic ended in-house PV module manufacturing in 2022, but the EverVolt brand continues through partner manufacturing, and Panasonic's HIT heterojunction technology legacy — high efficiency and a gentle ~−0.26%/°C temperature coefficient — influenced a generation of module design. Current EverVolt-class modules remain available through distribution.
What does a megawatt-scale commercial solar system cost?
Illustratively, a ~3.9 MW commercial installation at roughly $1.10/W runs about $4.3M before incentives, or ~$3.0M net after the 30% federal ITC. Against ~5,900 MWh/year of production valued at a $0.12/kWh blended retail offset, simple payback lands near four to five years — before rate escalation and bonus credits improve it.
What should a business check before installing rooftop solar?
Twelve months of interval load data, roof age and structural capacity, utility interconnection capacity at the service point, tax-credit and safe-harbor timing, and equipment specified for a 30-year service life with monitoring and O&M contracted from day one. Re-roofing before installation is almost always cheaper than removing and reinstalling the array later.
How much energy does a commercial solar array produce per MW?
A fixed-tilt US commercial array typically produces 1,200–1,700 MWh per MW of DC capacity per year depending on irradiance, tilt, and losses — a 13–19% capacity factor. The Panasonic case-study figure of ~5,900 MWh from ~3.9 MW implies about 1,510 MWh/MW-year, squarely in the healthy middle of that range.
Planning Your Facility's Largest Photovoltaic System?
Commercial modules, inverters, racking, and full BOS with domestic-content-capable options — 50,000+ SKUs, 169 brands, nationwide LTL freight from Louisville, KY. Bring the load data; we'll bring the BOM.
Shop Commercial Solar Request a Project QuoteRelated Guides & Resources
- Solar ROI Calculator — run the payback math on your tariff
- Solar System Calculator — size the array
- Solar Permitting Guide
- Interconnection Backlog 2025–2026
- IRA Tax Credits for Commercial Buyers
- Solar Panel Comparison Tool
- Commercial Solar Panels
- Solar Inverters
- Batteries & Energy Storage
About PES Supply
PES Supply is a nationwide distributor of Tier 1 solar panels, inverters, battery storage, racking, and complete electrical project kits — 50,000+ SKUs across 169 authorized brands with full OEM warranties and nationwide LTL freight from our Louisville, Kentucky supply house. Phone: 1-888-876-0007 • portlandiaelectric.supply
Sources: Panasonic project announcements (panel count, annual generation, CO₂ figures); EPA greenhouse gas equivalency factors. Derived capacity and economics are estimates, marked as such.
Disclaimer: Economic examples are illustrative, not quotes. Tax credit eligibility requires professional advice and current IRS guidance.