The number on a commercial solar proposal is a stack of smaller numbers, and the businesses that get good outcomes are the ones who can take the stack apart. I've reviewed proposals where the modules were priced beautifully and the switchgear line was padded by forty percent, and others where a cheap quote hid a service upgrade the utility was always going to demand. This guide breaks commercial solar cost into its real components — hardware, soft costs, labor, incentives, and financing — with the math shown, so you can audit any proposal line by line. It is written for developers, EPCs, facility managers, and CFOs who want to know where every dollar goes before they sign.
Decoding your initial investment in solar
Baseline commercial solar costs
The honest starting point for any commercial solar conversation is gross installed cost per watt: the total project price, before incentives, divided by nameplate DC watts. For standard commercial rooftop projects in the current U.S. market, that number typically lands between $1.50 and $2.50 per watt, with small commercial (under 100 kW) at the top of the band and multi-hundred-kW warehouse projects at the bottom. Ground mounts and carports price above rooftops; complex roofs and constrained urban sites price above the band entirely. Any proposal far below $1.50/W deserves more scrutiny than celebration — someone is omitting scope, and omitted scope always resurfaces as a change order.
Estimated commercial solar costs before incentives
Translating per-watt pricing into project budgets at three common sizes:
| Commercial Application | Typical System Size (kW) | Estimated Gross Cost Range |
|---|---|---|
| Small Retail or Office | 50 kW | $90,000 – $130,000 |
| Medium Warehouse/Mfg | 100 kW | $180,000 – $260,000 |
| Large Commercial Rooftop | 250 kW | $450,000 – $650,000 |
Read the pattern: doubling from 50 kW to 100 kW doubles the dollars, but stepping to 250 kW gets you 2.5× the watts for about 2.5× the money — per-watt cost has already fallen. The midpoint math: 50 kW at $110,000 is $2.20/W; 250 kW at $550,000 is $2.20/W... except the 250 kW row's range center is actually closer to $2.20/W only at the top; at $450,000 it's $1.80/W. That $0.40/W spread is scale economics doing its work, and it's why aggregating two buildings into one project often beats doing them separately.
The bigger picture: your net investment
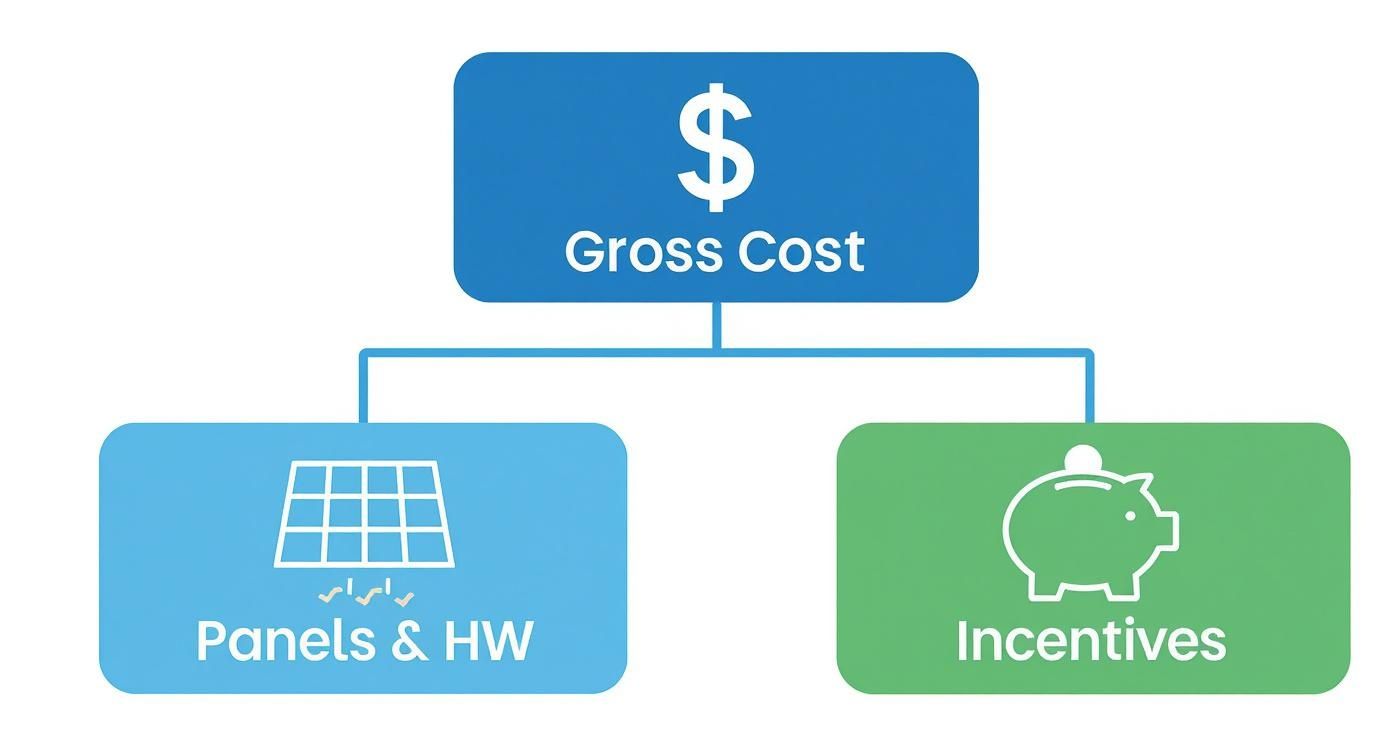
Gross cost is a straw man. Between the federal Investment Tax Credit, accelerated depreciation, and state incentives, the net cost to a tax-paying business routinely lands at 45–60% of gross. A $550,000 project with a 30% ITC ($165,000) and MACRS value around $95,000 (at a 21% federal rate, after the ITC basis reduction) carries a net cost near $290,000 — call it $1.16/W on a 250 kW array. Every financial comparison should be run on net cost, and any proposal that advertises gross-cost payback is underselling the project or hiding weak incentives handling.
Breaking down your commercial solar quote
Core hardware: the big three components
Modules, inverters, and racking are the visible hardware, and together they're usually less than half the project cost. That's the insight most first-time buyers miss: commercial solar is predominantly a soft-cost and labor business, which means procurement skill matters at least as much as hardware selection.
Commercial solar project cost breakdown
| Cost Component | Percentage of Total Project Cost (Approx.) | Key Considerations for Procurement |
|---|---|---|
| Solar Panels (Modules) | 25% - 35% | Tier 1 status, efficiency, warranty, and degradation rate are critical. |
| Inverters | 5% - 10% | Match inverter type to site conditions; consider brand bankability. |
| Balance of System (BOS) | 10% - 15% | Don't skimp on quality racking and electricals; it's a safety issue. |
| Labor & Installation | 15% - 20% | Experienced, certified installers reduce risk and ensure quality. |
| Permitting & Inspection | 5% - 10% | Varies widely by jurisdiction; experienced partners can navigate this. |
| Engineering & Design | 5% - 8% | Proper design maximizes output and ensures structural integrity. |
| Overhead & Profit | 10% - 15% | Covers the installer's operational costs and margin. |
Add the midpoints: 30 + 7.5 + 12.5 + 17.5 + 7.5 + 6.5 + 12.5 ≈ 94%. The remainder is contingency, interconnection fees, and financing costs — which is why a quote that sums to exactly 100% with no contingency line is a quote written by an optimist.
Tier 1 brands vs. the field
Tier 1 is a bankability classification — a measure of whether lenders will finance projects using that manufacturer — not a lab test. The practical buying implications: Tier 1 modules carry stronger warranty infrastructure and replacement pipelines, price at a premium of roughly $0.03–$0.08/W over credible non-Tier-1 product, and hold resale value in the secondary market. On financed projects, lenders may require Tier 1, which settles the question for you. Cross-check claims against the current Tier 1 list and the explanation of what Tier 1 actually measures before paying the premium.
Hidden costs every project manager must anticipate
The five budget-killers I see most often:
- Electrical service upgrades. NEC 705.12's 120% rule limits load-side solar connections; a 1,000 A bus accepts at most a 200 A solar backfeed breaker. Bigger systems need supply-side taps or service upgrades — $15,000 to $60,000+ that never appears in the teaser quote.
- Roof remediation. Re-roofing under a planned array adds $3–$7 per square foot, but doing it before installation beats lifting a finished array in year eight at any price.
- Utility interconnection upgrades. Transformer or feeder upgrades assigned by the utility can run five to six figures. The preliminary interconnection review is the cheapest project insurance available.
- Structural reinforcement. Older buildings sometimes need steel work to carry 4–6 psf of ballasted array plus snow drift loads against parapets.
- Prevailing-wage labor compliance. Full ITC rates for larger projects require prevailing wage and apprenticeship compliance — which raises labor cost and audit exposure simultaneously.
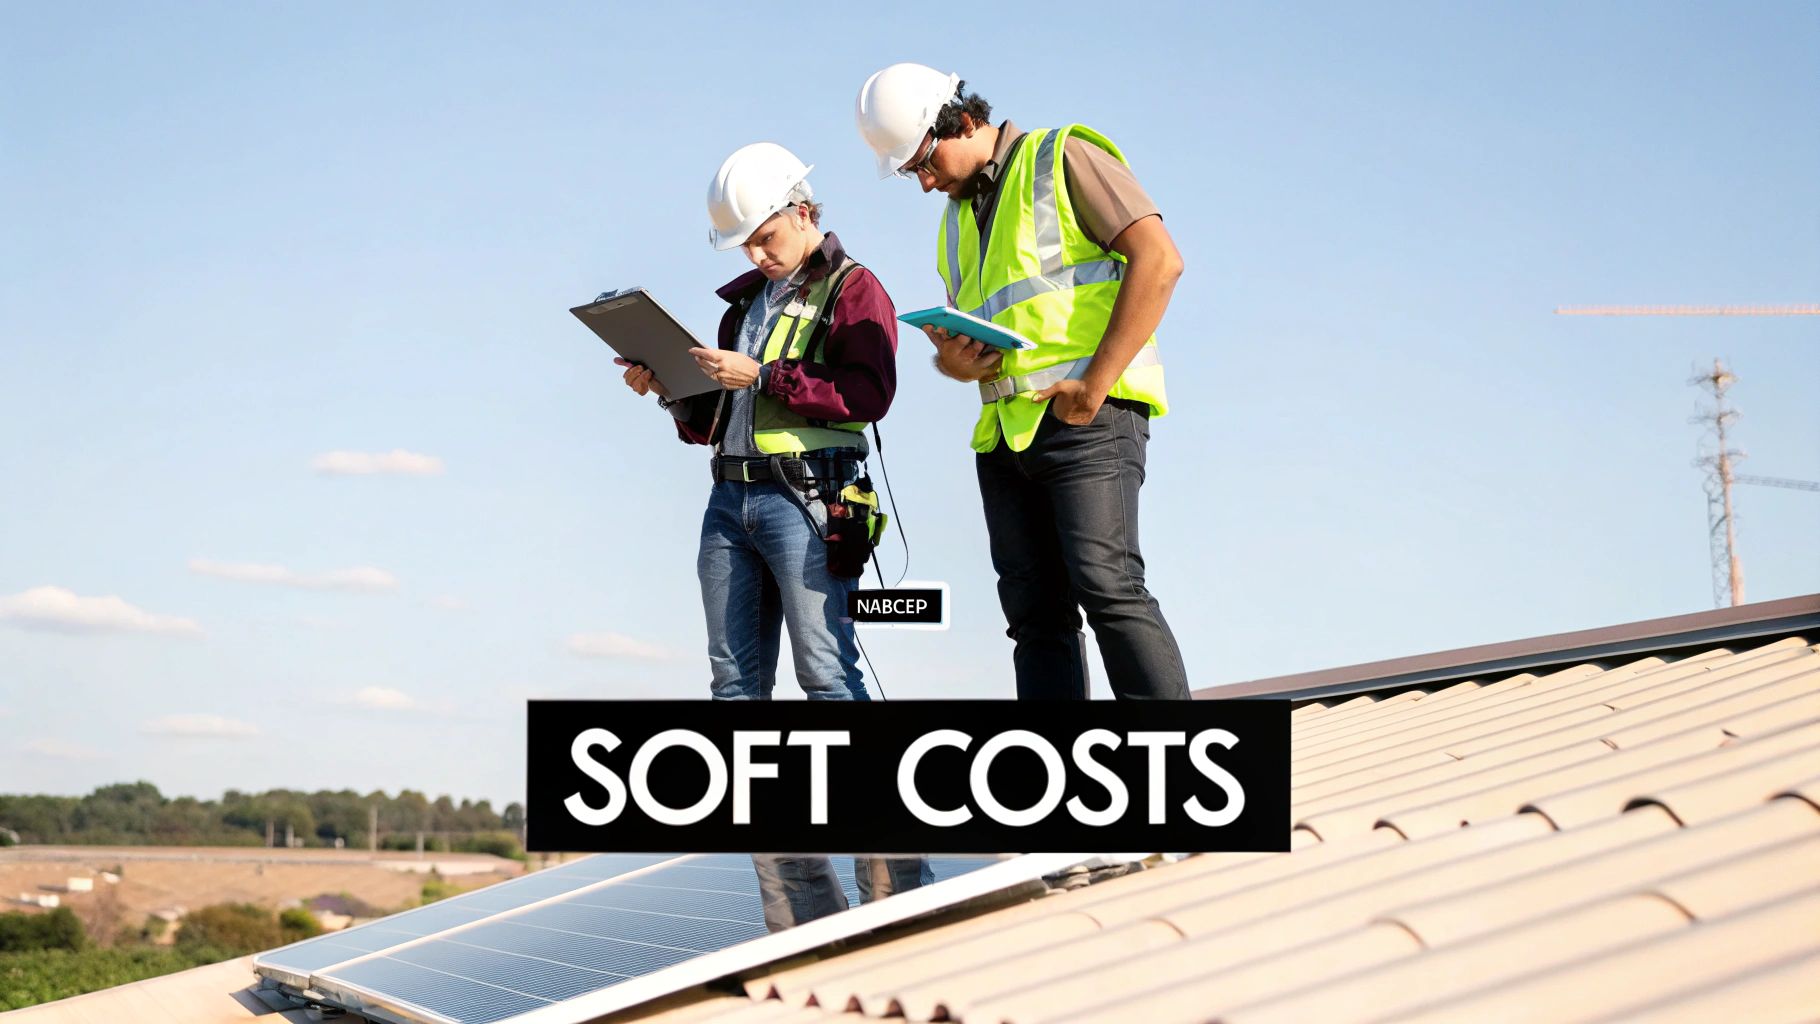
How soft costs and labor influence your final price
Engineering and permitting complexities
Commercial permitting is a multi-department marathon: structural review, electrical review, fire marshal (roof access pathways and rapid shutdown), planning for ground mounts and carports, and utility interconnection engineering as a parallel track. Engineering fees of 5–8% of project cost buy you the structural letters, stamped single-lines, and fire-layout drawings that keep this moving. Trying to save the engineering line is the classic false economy — a rejected plan set costs more in schedule than the engineer ever would have.
The impact of labor and site conditions
Labor at 15–20% of project cost swings with site difficulty more than with headcount. A flat, clear warehouse roof with staging access beside the array installs fast; a downtown rooftop with crane picks over a sidewalk, night-work requirements, and a 40-story hoist runs at a multiple of that. Union versus open-shop markets, prevailing-wage triggers, and regional labor availability all move the number. When comparing bids across regions or site types, normalize for these conditions before concluding one contractor is expensive.
Pro tip: reduce soft costs with smart procurement
The highest-leverage soft-cost move is consolidating procurement through a distributor who stocks the full BOM domestically — modules, inverters, racking, and electrical balance-of-system from one dock. Every consolidated shipment removes a freight line, a receiving event, and a schedule dependency. We've seen project schedules recover four to six weeks simply by eliminating the "racking arrived, wire didn't" problem. Our commercial solutions team structures exactly this kind of consolidated supply, and the commercial & industrial catalog shows the stocked depth.
Maximizing your ROI through incentives and tax credits
The federal Investment Tax Credit (ITC)
The ITC is the anchor incentive: a dollar-for-dollar credit against federal tax liability, calculated as a percentage of eligible project basis. The base rate stands at 30% for qualifying projects meeting prevailing-wage and apprenticeship requirements, with adders for domestic content (+10 points) and energy-community siting (+10 points) potentially stacking higher. The adders have documentation requirements — domestic content in particular requires manufacturer certifications and cost-percentage calculations that must be in place before procurement, not reconstructed at tax time. Verify current rates and your compliance obligations with tax counsel; the ITC is generous and the audit trail is real.
Accelerated depreciation (MACRS)
Solar property qualifies for 5-year MACRS accelerated depreciation, with the depreciable basis reduced by half the ITC claimed. The worked math on a $550,000 project claiming a 30% ITC: depreciable basis = $550,000 × (1 − 0.15) = $467,500; at a 21% corporate rate, that's $98,175 of tax shield, roughly 18% of gross cost, front-loaded into the early years. First-year bonus depreciation (the percentage phases under current law — verify the current figure) accelerates more of that shield into year one. Businesses without tax appetite can access both benefits indirectly through leases, PPAs, or transferability — each route sells the tax value at a discount, which is the cost of having no appetite.
| Incentive Component (Worked Example) | Calculation | Value on $550,000 Project |
|---|---|---|
| Federal ITC at 30% | $550,000 × 0.30 | $165,000 |
| MACRS depreciable basis | $550,000 × (1 − 0.30/2) | $467,500 |
| MACRS tax shield at 21% rate | $467,500 × 0.21 | $98,175 |
| Combined federal value | $165,000 + $98,175 | $263,175 (≈48% of gross) |
| Net project cost | $550,000 − $263,175 | $286,825 (≈$1.15/W on 250 kW) |
State and local incentives
State programs layer on top: SREC markets in several Mid-Atlantic and Northeast states pay per MWh generated (early participants in those markets have recovered 20–40% of project cost from SRECs alone); property-tax exemptions protect you from reassessment on the array's value; sales-tax exemptions remove 5–9% at procurement; and utility rebates still exist in scattered territories. The landscape changes annually, so verify with DSIRE (the public incentives database) and your tax advisor rather than last year's proposal template. For related cost reads, see our system installation cost breakdown and the PWRcell cost guide for storage pricing context.
Calculating your payback period and long-term value
Key financial metrics for solar projects
Four numbers carry the decision. Simple payback (net cost ÷ annual savings) is the sanity check — 4–8 years is the healthy commercial band. IRR captures the full 25-year cash flow; low-to-mid teens is typical for well-sited owned systems. LCOE (lifetime cost ÷ lifetime kWh) belongs next to your effective utility rate — and remember to convert demand charges into that effective rate or the comparison is rigged. NPV at your actual cost of capital is the decider, and sensitivity analysis at 0%/2%/4% utility escalation separates robust projects from optimistic ones.
A real-world payback example
Worked end-to-end on the 250 kW warehouse project: net cost $286,825 after federal incentives. Assume 1,450 kWh/kW-year production (Midwest-to-Sunbelt band) → 362,500 kWh annually. At a blended $0.11/kWh effective rate, year-one savings ≈ $39,875. Add modest demand savings and O&M costs net out near zero, so simple payback ≈ 286,825 ÷ 39,875 ≈ 7.2 years. Extend it: at 2.5% utility escalation and 0.5% annual degradation over 25 years, cumulative savings exceed $1.15 million against the $286,825 net — an NPV comfortably positive at any normal discount rate. Change the blended rate to $0.16/kWh (California, Northeast) and payback compresses toward 4.5 years; at $0.07 (parts of the Southeast and Mountain West) it stretches past 9. Your rate schedule is the project.
| Sensitivity Driver | Conservative | Base Case | Optimistic |
|---|---|---|---|
| Blended utility rate ($/kWh) | $0.09 | $0.11 | $0.14 |
| Simple payback (years) | ~8.8 | ~7.2 | ~5.7 |
| Utility escalation assumption | 1.5%/yr | 2.5%/yr | 3.5%/yr |
| 25-yr cumulative savings | ~$990,000 | ~$1,150,000 | ~$1,540,000 |
Comparing financing options
| Financing Option | How It Works | Best For |
|---|---|---|
| Cash Purchase/Loan | You own the system outright, paying with cash or a standard loan. | Businesses who want to maximize ROI and directly capture every tax credit, depreciation bonus, and cent of energy savings. |
| Solar Lease | A third party owns and maintains the system on your roof; you just pay a fixed monthly fee for the power. | Companies with limited capital or tax appetite who want predictable, lower energy bills without the hassle of ownership. |
| Power Purchase Agreement (PPA) | Similar to a lease, but you pay a pre-negotiated rate per kWh for the actual energy the system generates. | Large energy users like schools or municipalities looking for long-term price certainty with zero upfront cost. |
Two additions worth negotiating regardless of structure: a buyout schedule (for leases/PPAs, get the year-7 and year-15 buyout prices in writing now, because negotiating them later means negotiating with leverage you already handed over), and roof-restoration obligations at end of term. And if EV fleet charging is on your roadmap, size it into the financial model from the start — the EV charging installation cost analysis and our commercial EV installation guide cover those numbers.
Finding the right partner for your solar project
Vetting your installation and EPC partners
The vetting checklist I run clients through: three reference projects of similar size in your state (call them, don't just read the names); license and insurance verification with certificates issued to you; safety record (EMR below 1.0 is the standard screen); financial stability (an EPC that folds in year two orphans your workmanship warranty); and a production guarantee with actual remedies, not estimates dressed as commitments. Price is the fifth criterion, not the first — the cheapest EPC bid I've ever seen accepted cost the owner $200,000 in year-three remediation after the racking attachments voided the roof warranty nobody coordinated.
The distributor's role in project success
Between the factory and the job site sits the distributor, and on commercial projects that role is load-bearing: consolidated BOM procurement, domestic stocking that absorbs factory lead-time shocks, freight management, replacement-module pipelines for warranty events, and design support on electrical balance-of-system. A distributor with real commercial depth — three-phase inverters on the shelf, large-format modules in the yard, full system component coverage — compresses both schedule and risk. That's the business we're in at Portlandia; the brands we carry and our commercial installation cost coverage reflect it.
Module price trends and procurement timing
Module pricing is the most volatile line in the stack, and timing it has real value. Over the past several years, U.S. module prices have swung by 30% or more within single years on the back of trade actions, polysilicon cycles, and tariff moratoria expiring. Three practical rules follow. First, quotes decay: a module price older than 60–90 days is a hypothesis, so re-verify equipment pricing at contract execution, not at proposal. Second, allocation matters in tight markets — distributors with factory relationships get modules when brokers get apologies, which is a schedule argument as much as a price argument. Third, don't chase the bottom: the difference between catching a price trough and missing it is typically $0.03–$0.05/W, about $10,000 on a 250 kW project — real money, but less than one month of schedule slip costs in labor remobilization. Buy when the project is ready, from suppliers who can actually deliver.
The interconnection cost timeline
Interconnection is where commercial budgets go to die quietly. The sequence: application fee (hundreds to low thousands), utility engineering review (sometimes billed at cost), possible distribution-system impact study ($5,000–$30,000 for larger systems), and — the dangerous one — assigned upgrade costs if the study finds the local transformer or feeder can't host your export. Upgrade assignments range from a $12,000 transformer swap to six-figure feeder reconductoring, and they arrive after you've spent engineering money. The defenses: submit early, ask the utility for hosting-capacity data before final design, and write an upgrade-cost cap into your EPC contract with a walk-away trigger. A project that dies at the study stage costs you $20,000; the same project discovered unbuildable after mobilization costs ten times that.
Insurance and risk costs nobody itemsizes
Insurance touches the project three times. During construction, builder's risk coverage and the contractor's general liability protect the work — verify both certificates name your entity. At energization, the array joins your property policy: expect the added premium to run roughly 0.1–0.25% of system value annually, and confirm your carrier covers rooftop PV without exclusions for wind or hail in your territory — some carriers have tightened hail coverage in storm states precisely where solar is popular. Over the asset life, production risk matters too: a year-one hail event with a $50,000 deductible and a 90-day business-interruption lag is a cash-flow problem, not just a claim. Review the policy stack before PTO, while leverage with your broker is highest.
O&M reserves: pricing the next 25 years honestly
Proposals love to show 25-year savings with 25-year-old hardware assumptions. Honest models carry an O&M reserve of $10–$20 per kW per year — $2,500–$5,000 annually on a 250 kW system — plus two lumpy events: inverter replacement or major refurbishment around years 12–15 (string inverters: roughly $0.05–$0.10/W of original system size in today's dollars) and a racking/attachment inspection cycle tied to roof maintenance. Put together, a realistic lifetime O&M budget on a 250 kW rooftop is $90,000–$140,000 in nominal dollars. That number doesn't sink the project — it lands at maybe 8–10% of lifetime savings — but a model without it is fiction, and lenders increasingly know it.
Normalizing competing bids: the worksheet
When three proposals land with three different structures, normalize them before comparing:
- Convert everything to $/W gross and $/W net using identical incentive assumptions. If one bidder assumed a domestic-content adder and another didn't, you don't have comparable quotes.
- Align scope lines. Does each bid include the service upgrade, the roof work, the monitoring hardware, the prevailing-wage labor? Scope gaps masquerade as price leadership.
- Align production models. Same weather file, same degradation rate, same availability assumption. A 2% availability difference on a 250 kW system is worth roughly $800/year — small per line, decisive in aggregate.
- Price the schedule. A bid that starts construction in Q3 versus Q1 carries different incentive risk and different savings start dates. Late PTO has a dollar value; assign it.
- Price the counterparty. Warranty promises are worth the solvency of the entity behind them. A slightly higher bid from a contractor with fifteen years of local survival usually beats the discounter's paper.
Financing mechanics: what the debt actually costs
Commercial solar loans price off the project's risk profile: expect 15–25 year terms at rates a point or two above comparable commercial real-estate debt for strong borrowers, with 10–20% equity typical. C-PACE, where available, finances up to 100% over 20–30 years as a property-tax assessment — it survives property sales and typically prices below mezzanine debt, with the tradeoff of an assessment lien senior to your mortgage (get lender consent early). Green banks in several states offer credit enhancements that shave rates further. Run every structure through the same test: total lifetime payments minus total lifetime savings and incentives, then sanity-check the answer against cash ownership. The structure that wins on paper should also match your building-ownership horizon — a 25-year C-PACE lien on a building you'll sell in 8 years needs the buyer's underwriter on board before you sign, not during due diligence.
Cost by mounting type: roof, carport, and ground
Mounting choice is the biggest structural cost variable after scale. The comparison, before incentives:
| Mounting Type | Typical Gross $/W | Cost Driver | When It Wins |
|---|---|---|---|
| Ballasted flat roof | $1.50 – $2.10 | Lowest steel cost; no penetrations | Sound roofs with 15+ years of membrane life |
| Attached/pitched roof | $1.70 – $2.40 | Attachment labor, flashing, layout inefficiency | Smaller commercial and sloped roofs |
| Carport / canopy | $2.50 – $3.50 | Structural steel and foundations dominate | Constrained roofs; parking that earns shade value |
| Ground mount (fixed tilt) | $1.30 – $1.90 | Foundations, trenching, fencing, land prep | Available land near the service; largest systems |
The carport premium buys something real — shaded parking that tenants and employees value, and a structure that doesn't touch the roof warranty — but at $2.50–$3.50/W the energy economics need help from those side benefits or from incentives to pencil. Ground mounts surprise people by being the cheapest per watt at scale; the tradeoff is land, trenching distance, and permitting complexity rather than the array itself.
The documentation package your accountant will need
Incentive value is only real if it survives an audit, so assemble the paper as the project progresses, not in April. The package: executed contract and all change orders; itemized invoices separating eligible equipment from ineligible scope (land, roof work not integral to the array); placed-in-service evidence (permission-to-operate letter from the utility is the standard proof); prevailing-wage and apprenticeship compliance records if claiming the full ITC rate; domestic-content certifications if claiming that adder; and the interconnection agreement. On the depreciation side, your accountant needs the ITC basis-reduction calculation and the cost segregation if any portion of the project (like a new roof section) is being carved out of eligible basis. I've seen six figures of credit value put at risk by a missing PTO letter; it is a one-page document that takes the utility weeks to reissue. File it the day it arrives.
Proposal tricks to watch for
Four patterns recur in weak proposals. The stranded escalator: savings modeled at 4–5% utility escalation without disclosure — demand the escalation rate in writing and re-run at 2%. The phantom demand saving: PV-only proposals booking full demand-charge reduction, which weather makes unreliable; only storage-backed demand savings deserve full credit. The scope ellipsis: quotes that exclude "utility fees" or "service modifications, if required" — translate that language into a dollar range before comparing. The production inflation: models using optimistic shading or availability assumptions; ask for the P50/P90 split, because lenders use P90 and so should you. None of these are necessarily dishonest — but all four move money from your pocket to the projection, and all four survive only in unread proposals.
Adding storage: what batteries do to the budget
Storage is increasingly part of the commercial conversation, so budget it honestly. Commercial-scale LFP systems (100 kWh–1 MWh) typically install at $700–$1,100 per kWh all-in, depending on duration, interconnection complexity, and controls integration — a 250 kWh unit lands around $175,000–$275,000 before incentives. The ITC covers standalone storage as well as solar-paired, which softens the blow. Storage earns through demand-charge management, TOU arbitrage, and resilience value; on rate schedules with $20+/kW demand charges and predictable peaks, the payback can beat the solar it accompanies. Where it doesn't pencil today, design storage-ready anyway: reserved breaker space, transformer headroom, and a controls pathway cost nearly nothing at build time. Our BESS design guide and battery cost breakdown cover sizing economics in detail.
Timing the market: when to sign
Buyers ask whether to wait for cheaper modules. The arithmetic usually says no: if module prices drift down $0.03/W over a year of waiting, a 250 kW project saves $7,500 — while the same project loses a year of energy savings worth roughly $40,000 and a year of incentive certainty. Waiting pays only when a known price step (a tariff expiry, a confirmed factory capacity wave) is weeks away, not seasons. The contrarian case exists for buyers whose interconnection queue is 18 months anyway — in that case, procure late and let equipment prices work for you while the utility works at its own pace. The rule that has served our customers best: lock the project economics at net cost, procure equipment as late as the construction schedule safely allows, and never speculate on incentive policy with a signed contract.
Total cost of ownership: the 25-year ledger
Pull the whole life together on one ledger for the 250 kW reference project: net capital $286,825 after federal incentives; lifetime O&M reserve $90,000–$140,000 nominal; inverter refurbishment around year 13, $12,000–$25,000; insurance incremental premium roughly $600–$1,400/year; monitoring and communications $300–$800/year. Total lifetime ownership cost lands near $430,000–$490,000 nominal against $1.0–$1.5 million of cumulative savings in the base case. That 2–3× spread between lifetime cost and lifetime value is the commercial solar proposition in one line, and it's why the conversation with a CFO should always be framed as a 25-year infrastructure decision rather than a purchase. The year-one number is the cover page; the ledger is the book.
Reading your utility bill before you read any proposal
Every number in this guide means nothing until it meets your actual bill. Pull twelve months and mark three things: the energy charge per kWh (including riders and fuel adjustments, which in some territories add 20–30% to the headline rate), the demand charge per kW and how the billing demand is defined (measured peak, ratcheted peak, or time-differentiated), and the rate schedule's solar tariff options — some utilities move solar customers to different schedules, for better or worse. Then compute your blended effective rate: total annual bill divided by annual kWh. That blended figure, not the tariff's headline energy rate, is what your solar offsets. Facilities with heavy demand components sometimes discover their effective rate is 30% above the energy charge, which transforms the projected economics — and occasionally reveals that demand management, not generation, is the first dollar to spend. The benefits of commercial solar overview frames the strategic case once your bill math is clear.
One closing discipline worth adopting: re-run the full model every time a material input changes — a revised utility study, a module price refresh, an incentive program update, a schedule slip. Commercial solar projects live for a year or more between first proposal and permission to operate, and the assumptions rot faster than the steel. The teams that keep the model current never get surprised; the teams that laminate the first spreadsheet meet every surprise personally, usually at a change-order meeting. Keep the model alive, keep the documentation current, and the project will treat you the same way. That discipline — more than any single price point — is what separates the projects that get remembered fondly from the ones that get litigated.
Frequently asked questions
How much do commercial solar panels cost per month?
Owned systems have no monthly payment — the cost is upfront capital plus modest O&M. Financed systems convert that capital to a monthly note: a $550,000 project financed over 15 years at 7% runs roughly $4,940/month before energy savings. Under a PPA or lease, the "monthly cost" is your payment to the system owner, typically set 20–40% below what the same energy would cost from the utility.
Do solar panels require a lot of maintenance?
No. Commercial arrays need annual inspections, monitoring review, and occasional cleaning — typically $10–$20 per kW per year under a professional O&M contract, which is about $2,500–$5,000 annually for a 250 kW system. Inverters are the wear item; budget for replacement or refurbishment around years 12–15.
Can my roof support the weight of solar panels?
Most modern commercial roofs can. A ballasted rooftop array adds roughly 4–6 pounds per square foot — well within the design load of typical steel-deck commercial construction. The structural review (a few thousand dollars) is mandatory regardless: it also checks snow-drift loads against parapets and the roof membrane's remaining life, which matters as much as the weight.
How does system size impact the cost per watt?
Per-watt cost falls as systems grow because fixed soft costs — engineering, permitting, interconnection, mobilization — spread across more watts. Expect roughly $2.20–$2.50/W at 50 kW, $1.80–$2.20/W at 100–250 kW, and $1.50–$1.80/W approaching 1 MW, before incentives. Site difficulty can override scale: a complex urban rooftop at 300 kW can cost more per watt than a simple warehouse at 100 kW.
What is the difference between gross cost and net cost?
Gross cost is the contract price. Net cost subtracts the ITC, depreciation tax shield, and state incentives. A $550,000 gross project commonly nets near $287,000 for a tax-paying owner — always compare proposals and payback claims on the net figure.
How long until a commercial solar system pays for itself?
Simple payback typically runs 4–8 years depending on your utility rate, incentives, and site. High-rate states with SREC income compress payback toward 4 years; low-rate territories stretch toward 9–10. The system then produces 15–20 more years of nearly free energy after the payback point.
Related resources
- Commercial Solar Panels: The Ultimate Buyer's Guide
- Solar Panels for Commercial Buildings
- Solar Panel System Installation Cost
- Commercial Solar Installation Costs (News Analysis)
- Commercial Solar Savings Potential
- Commercial EV Charging Station Installation
- Commercial & Industrial Equipment
- Commercial Energy Solutions
The businesses that win at commercial solar share one habit: they audit the cost stack before they negotiate the total. Know what the modules should cost, what the labor should cost, what the incentives are worth, and what your rate schedule actually pays — and every proposal you ever receive becomes readable in ten minutes, and every sales meeting gets a lot shorter. That literacy is the entire point of this guide, and it compounds on every project that follows the first one.