Benefit 1: Dramatically Lower Electricity Operating Costs
Every commercial electric bill has two layers of pain: the energy you consume (kWh charges) and the demand spikes you hit for fifteen minutes a month (kW demand charges). A well-designed commercial solar array attacks the first layer directly, and — paired with storage or smart controls — can shave the second. For a business spending $4,000 a month on electricity, offsetting 70% of consumption is not an abstract environmental gesture; it is $33,000 a year of operating cost converted into a fixed asset on your own roof.

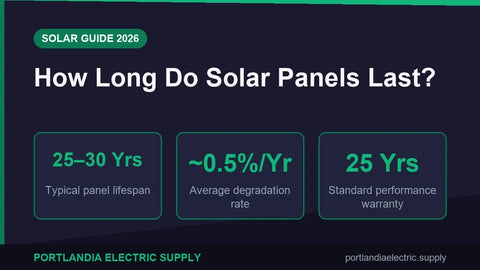
The math that matters is levelized cost of energy. A turnkey commercial system in the current market runs roughly $1.80–$2.40 per watt before incentives. At $2.10/W, a 100 kW array costs $210,000 gross and produces, in a 4.5 peak-sun-hour region at an 0.82 performance ratio, about 134,600 kWh in year one. Over 25 years, with 0.5% annual degradation, that array delivers roughly 3.08 million kWh. Divide the post-incentive capital cost (detailed below) by lifetime production and you get an LCOE between 3.5 and 5 cents per kWh — against utility commercial rates that commonly run 11 to 24 cents depending on state and rate class.
Benefit 2: Federal and State Incentives That Actually Move the Number
The federal Investment Tax Credit remains the single largest line item in commercial solar economics: 30% of installed cost as a dollar-for-dollar tax credit, with additional bonus adders (domestic content, energy community) that can push the effective credit to 40% or more on qualifying projects. Layer accelerated depreciation on top — 5-year MACRS with bonus depreciation — and the after-tax capital cost of a system drops by roughly half before you produce the first kilowatt-hour.
| Cost / Incentive Component (100 kW example @ $2.10/W) | Amount |
|---|---|
| Gross installed cost | $210,000 |
| Federal ITC (30%) | −$63,000 |
| MACRS depreciation value (5-yr, 24% federal+state bracket, 85% basis) | ≈ −$42,800 |
| Typical state/utility incentive (varies widely) | −$0 to −$25,000 |
| Effective net capital cost | ≈ $79,000–$104,000 |
That net cost against 3.08 million lifetime kWh is the 3.4-cent LCOE floor. Incentive rules shift session to session, so confirm current percentages with your CPA and check our state-by-state breakdown on the solar incentives by state page before you model. I always tell owners the same thing: never let a salesperson quote you a net price without showing the bracket assumptions behind the depreciation number.
Benefit 3: Protection Against Rising Electricity Rates
Utility commercial rates have climbed at a long-run average of roughly 2.5–3% per year, with several consecutive years well above that trend in many territories. Solar converts a volatile operating expense into a fixed, known cost of production. Here is what escalation does to a business currently paying $0.14/kWh for 120,000 kWh a year — and what locking in solar generation is worth against it:
| Year | Utility Rate @ 3%/yr | Annual Bill (120 MWh) | Solar-Offset Portion (100 MWh) Avoided |
|---|---|---|---|
| 1 | $0.140 | $16,800 | $14,000 |
| 5 | $0.158 | $18,960 | $15,800 |
| 10 | $0.183 | $21,960 | $18,300 |
| 15 | $0.212 | $25,440 | $21,200 |
| 20 | $0.246 | $29,520 | $24,600 |
| 25 | $0.286 | $34,320 | $28,600 |
After degradation, the array still covers about 87,800 kWh in year 25, so the real avoided cost is slightly lower — but the shape of the argument never changes: every year the utility raises rates, your solar kilowatt-hour gets more valuable while its cost stays frozen at the day-one LCOE. Cumulative avoided cost on the offset portion alone exceeds $540,000 over the period against a net capital cost near $100,000.
Benefit 4: Resilience and Energy Independence
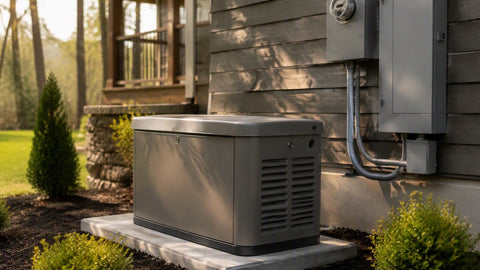
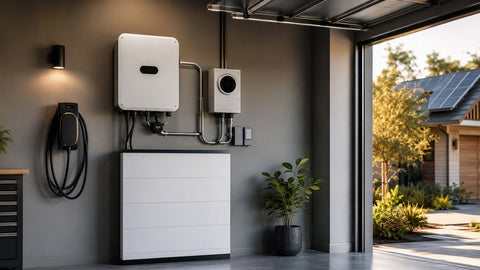
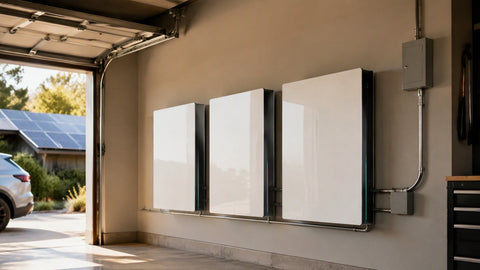
A grid-tie-only array shuts down in an outage — anti-islanding is not optional. But commercial solar becomes a resilience asset the moment you add storage or a transfer scheme. Pairing a 100 kW array with a 100–200 kWh battery from our commercial and industrial battery collection keeps refrigeration, point-of-sale, network gear, and critical lighting alive through multi-hour outages, and demand-charge shaving from the same battery often pays for the storage on its own. For facilities where outages are existential — cold storage, clinics, data closets — the combination of solar, storage, and a standby unit from the commercial standby generator line creates a three-layer defense that no single technology delivers alone. If you are scoping the generator side, our generator sizing guide walks the load math.
Benefit 5: Increased Commercial Property Value
Appraisers increasingly capitalize energy savings into building value. The arithmetic is straightforward: under an income-approach valuation at a 7% cap rate, every $10,000 of reduced annual operating expense supports roughly $143,000 of additional property value. A solar array saving $25,000 a year can therefore underpin $350,000 or more in appraised value — several times its net installed cost — while owned (not leased) systems transfer cleanly at sale and often command faster lease-up on multi-tenant buildings. Studies of commercial transactions consistently show solar-equipped buildings selling at premiums, and tenants paying real money for lower, predictable utility pass-throughs.
Benefit 6: Sustainability Credentials With Actual Receipts
Procurement departments at large buyers now ask for emissions data in RFPs, and solar gives you auditable numbers instead of marketing adjectives. The carbon math for our 100 kW reference array:
| Metric | Value | Basis |
|---|---|---|
| Year-1 production | 134,600 kWh | 100 kW × 4.5 PSH × 365 × 0.82 PR |
| Grid emissions factor (US average) | ≈ 0.85 lb CO₂/kWh | eGRID-style national average |
| Year-1 CO₂ avoided | ≈ 57 metric tons | 134,600 × 0.85 ÷ 2,204.6 |
| 25-year CO₂ avoided | ≈ 1,300 metric tons | 3.08 M kWh lifetime, same factor |
| Passenger-car equivalent | ≈ 280 car-years | 4.6 t CO₂ per car-year |
Those numbers feed ESG reports, B Corp recertification, and customer-facing sustainability pages with defensible methodology. I have sat in on customer tours where the facilities manager pulled live monitoring up on the lobby screen — that screen closes more deals than any brochure ever printed.
Benefit 7: Reduced Carbon Footprint and Lower Regulatory Risk
Beyond voluntary reporting, carbon is becoming a compliance line item. State clean-energy standards, building performance standards in a growing list of cities, and potential carbon pricing all push in one direction: facilities with on-site generation face smaller future liabilities. An array installed today locks in emissions reductions at today's equipment prices rather than tomorrow's compliance-market prices. Businesses that wait are betting that regulations get looser — a bet with a poor recent track record.
Real Numbers: What a Commercial Project Actually Delivers
Pulling the threads together on the 100 kW reference project at $2.10/W in a $0.14/kWh territory: net capital cost after ITC and depreciation lands near $90,000; year-one avoided cost is about $18,800 (134,600 kWh × $0.14); simple payback lands between years 4 and 5; the 25-year internal rate of return computes to roughly 18–22% depending on escalation assumptions. Few capital projects available to an operating business carry that risk-adjusted return with this little execution risk — no new staff, no new customers, no market risk. The sun does not churn.
Which Businesses Benefit Most
| Business Profile | Solar Fit | Why |
|---|---|---|
| Owner-occupied warehouse / manufacturing | Excellent | Big flat roofs, daytime loads, full tax appetite |
| Retail with refrigeration | Excellent | High, steady daytime consumption; resilience value |
| Office buildings | Very good | Daytime-peaking load matches solar curve |
| Agriculture / cold storage | Excellent | Rural incentives, huge roof or ground area, demand charges |
| Leased-space tenant | Poor | No roof rights; consider a PPA or green tariff instead |
| Nonprofit without tax appetite | Moderate | Direct-pay ITC or third-party PPA structures required |
How to Start Without Getting Burned
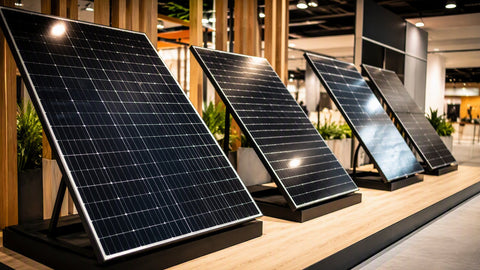
Begin with twelve months of interval utility data, not a satellite quote. Interval data exposes demand-charge structure and tells you whether storage belongs in year one. Then get three bids that each show the same five numbers: DC system size, year-one production estimate with its performance ratio, gross cost per watt, incentive assumptions spelled out, and degradation-adjusted 25-year cash flow. Any bid missing one of those five is a brochure, not a proposal. Our commercial solar installation cost breakdown gives you the benchmark ranges to grade those bids against, and the commercial solar catalog shows the panel, inverter, and racking tiers we actually quote from. For ground-mount or carport options, the racking systems guide covers the structural trade-offs. Browse current module inventory in commercial solar panels and inverter options in commercial solar inverters.
Demand Charges: The Half of the Bill Solar Alone Misses
Pull up a commercial tariff sheet and you will usually find two meters running: energy (kWh) and demand (kW). Demand charges bill your single highest fifteen-minute usage spike each month, and on many commercial tariffs they account for 30–50% of the total bill. Solar energy offsets kWh beautifully, but a cloud crossing the roof at the wrong fifteen minutes leaves your demand peak untouched. This is the most common disappointment I debrief with new commercial customers — not that solar failed, but that nobody modeled the demand line. The fixes are real and measurable: battery storage dispatched against peaks, load scheduling that moves compressors and chargers off the solar valley, and solar-plus-storage controls that watch the meter in real time.
| Bill Component (example small industrial) | Without Solar | Solar Only | Solar + 100 kWh Storage |
|---|---|---|---|
| Energy: 60,000 kWh/mo @ $0.11 | $6,600 | $2,900 (56% offset) | $2,900 |
| Demand: 180 kW @ $14/kW | $2,520 | $2,380 (cloud risk) | $1,260 (peak shaved to 90 kW) |
| Fixed / riders | $480 | $480 | $480 |
| Monthly total | $9,600 | $5,760 | $4,640 |
The storage column saves an additional $1,120 a month in this example — $13,400 a year — which is why demand-heavy tariffs almost always justify batteries even where pure backup value is low. Model your own tariff before assuming either column; rate structures vary wildly between utilities.
Financing Structures: Cash, Loan, PPA, and Lease

How you pay changes who captures which incentive, so compare structures on after-tax lifetime cost, not the monthly payment:
| Structure | Who Owns ITC/Depreciation | Best For | Watch Out For |
|---|---|---|---|
| Cash purchase | You | Strong balance sheet, full tax appetite | Capital tied up; payback 4–7 yrs |
| Solar loan | You | Ownership economics with preserved cash | Rate and term vs. savings curve |
| PPA | Third party | No capital, immediate bill reduction | Escalator clauses; no ownership upside |
| Operating lease | Lessor | Off-balance-sheet preference | End-of-term buyout terms |
For most owner-occupied businesses with tax liability, cash or loan wins on lifetime value by a wide margin. PPAs shine for nonprofits and capital-constrained operators who value certainty over upside. Run both structures through the solar ROI calculator with your actual tax bracket — the answer flips more often than you would expect.
A Real Commercial Project Timeline
Owners consistently underestimate the calendar. From signed contract to permission-to-operate on a straightforward 100–300 kW rooftop, plan on four to seven months: two to four weeks for engineering and structural review, four to eight weeks for utility interconnection study and approval (the wildcard — some utilities answer in days, others in quarters), two to six weeks for AHJ permitting, two to four weeks of on-roof construction for this size class, then inspection and meter swap. Equipment lead times have normalized from the shortage years, but transformers and switchgear for larger services still run long. I tell every customer to sign the interconnection application before the equipment contract whenever possible — the utility clock is the one you cannot expedite.
Operations, Maintenance, and What Actually Breaks
Commercial solar is close to boring, which is the point. Annual O&M budgets run $8–$15 per kW: a yearly inspection, monitoring review, torque checks, and cleaning where soiling justifies it (most rain-washed climates skip cleaning entirely). What actually fails, in order of frequency in my experience: monitoring gateways and communication hardware, inverter fans and capacitors around year eight to twelve on central units, connector faults from sloppy installation, and — very rarely — modules. Rodent damage to rooftop wiring is the sleeper issue in agricultural and semi-rural sites; specify critter guard at install, because retrofitting it costs triple. Budget one inverter-class replacement event over 25 years on string architectures and your pro forma will survive contact with reality.
The Mistakes That Kill Commercial Solar Projects
After watching projects succeed and fail for years, the failure list is short and repetitive. First, sizing to the roof instead of the load: net metering rules cap the value of exported energy in many territories, so a system producing 140% of consumption can pencil worse than one producing 85%. Second, ignoring the roof itself — a roof with eight years of life left gets replaced before the array goes on, not after, unless you enjoy paying to remove and reinstall 400 modules. Third, assuming the tax credit without confirming tax appetite; passive activity rules and insufficient liability strand credits more often than the brochures admit. Fourth, skipping the structural letter on older buildings; a 1970s bar-joist roof may need reinforcement that changes the whole pro forma. Fifth, choosing a bidder on price per watt without checking their service organization — the installer who answers the phone at year nine is worth a nickel a watt at year zero.
Case Study: A Pacific Northwest Fabrication Shop
A metal fabrication customer outside Salem came to us spending about $7,800 a month on a demand-heavy industrial tariff. Their load profile was ideal: two shifts, five days a week, heavy compressor and welder draw from 7 AM to 4 PM — nearly perfectly overlapping the solar window. We installed a 240 kW rooftop array (414 modules at 580W) with three string inverters and no storage in phase one, because their demand peaks tracked the sun anyway. Year-one results against model: production 296,000 kWh modeled, 302,400 kWh actual — 2% over, thanks to a cool, bright spring. Energy charges dropped 61%. Demand charges fell only 9% in the solar-only configuration, exactly as modeled, which is why phase two — a 200 kWh battery dispatched on peak prediction — went in the following year and cut the demand line another 38%. Total project payback tracking to 4.8 years. The lesson that matters: the model told the truth because we built it from twelve months of interval data instead of a monthly bill average.
Rooftop, Ground-Mount, or Carport?
Commercial sites with land have a genuine choice. Rooftops use dead space and cost the least per watt for racking, but they inherit the roof's age, orientation, and structural limits. Ground mounts let you set perfect tilt and azimuth, simplify cleaning and service, and scale past roof area — at the cost of trenching, foundations, and sometimes fencing. Carports cost the most per watt in steel but deliver dual value: shaded parking that employees and customers notice every day, plus a structure that often qualifies for the same incentives. On sites with expansion plans, I usually recommend designing the electrical infrastructure — conduits, switchgear pads, interconnection capacity — for the full build-out even when phase one is rooftop-only. Conduit is cheap in year one and painful in year six.
Interconnection and Net Metering: The Rulebook That Writes Your Returns
Utility territory rules shape project economics as much as equipment does. Three questions to answer before any other: Does your utility offer true net metering (retail-rate credit for exports), net billing (avoided-cost or market-rate credit), or no export compensation at all? What is the cap on system size relative to historical load? And what does the interconnection study process cost at your size class? In net-billing territories the design target shifts from maximum production to maximum self-consumption — smaller arrays, possible storage, and load shifting. Several utilities also impose standby charges or additional metering fees above certain thresholds. None of this is a reason not to build; all of it is a reason to model with real tariff sheets. Our team pulls current tariff structures during quoting, and the incentives page tracks the state-level policy layer on top.
Pairing Solar With EV Fleet Charging
Businesses electrifying fleets face a compounding bill problem: EV chargers add exactly the kind of spiky daytime demand that tariffs punish. Solar plus charging, designed together, is the antidote. A delivery fleet that charges mid-day between routes can consume solar electrons at the 3–5 cent LCOE instead of the 11–24 cent utility rate, and managed charging smooths the demand peaks that unmanaged chargers create. If fleet electrification is anywhere on your five-year plan, tell your solar designer now — upsizing the array and reserving panel capacity costs little at design time and a fortune at retrofit. Our EV charging station cost guide covers the charging side of the budget.
The Seven Benefits at a Glance
| Benefit | Typical Magnitude (100 kW reference system) | Time Horizon |
|---|---|---|
| Lower operating costs | $15,000–$20,000/yr energy savings | Immediate, growing with rates |
| Federal and state incentives | $105,000–$130,000 captured (ITC + MACRS) | Years 0–5 |
| Rate escalation protection | $540,000+ cumulative avoided cost | 25 years |
| Resilience with storage | Critical loads through multi-hour outages | From commissioning |
| Property value increase | ≈ $250,000–$350,000 capitalized value | At appraisal / sale |
| Sustainability credentials | ≈ 57 t CO₂/yr with auditable data | Annual reporting |
| Regulatory risk reduction | Locked-in compliance position | Ongoing |
Measuring Success After Energization
Commissioning day is the starting line, not the finish. The owners who extract full value from commercial arrays track four numbers monthly: specific yield (kWh per kW — compare against the model's weather-adjusted expectation, not raw sunshine), performance ratio (anything sustained below 0.75 deserves a service call), self-consumption percentage (exported energy at net-billing rates is worth a fraction of offset energy), and demand-peak coincidence (did your monthly peak land inside or outside the solar window). A monitoring platform that reports these automatically costs a rounding error against the asset and pays for itself the first time it catches a tripped breaker in week two instead of month eleven. One customer of ours recovered $9,000 in a single year from a monitoring alert that caught a failed optimizer batch — the warranty claim practically wrote itself from the data log.
Why Source Through Portlandia Electric Supply
We are a wholesale electrical and solar distributor, not an installer marketing arm — which means our incentive is getting your bill of materials right, not selling you a financing product. Contractors and owner-builders source complete commercial packages from our commercial solar catalog, with panels, inverters, racking, and balance-of-system gear quoted together so compatibility questions get answered before the truck arrives, not on the roof. Send us your interval data and roof plan and we will come back with a component-level quote and an honest opinion about whether your project pencils. Sometimes the honest answer is "not yet" — a tariff change, a roof replacement, or a rate-class switch can turn a marginal project into a strong one twelve months later, and we would rather tell you that than sell you a mediocre system.
The 25-Year Cash Flow, Year by Year
Pro formas fail when they assume flat savings. Here is the disciplined version for the 100 kW reference project — $90,000 net capital cost, $18,800 year-one avoided cost, utility escalation at 3%, module degradation at 0.5% (combined growth factor ≈ 1.0249 per year):
| Milestone Year | Annual Savings That Year | Cumulative Savings | Position vs. $90k Net Cost |
|---|---|---|---|
| Year 1 | $18,800 | $18,800 | −$71,200 |
| Year 5 | ≈ $20,700 | ≈ $98,800 | Payback achieved |
| Year 10 | ≈ $23,500 | ≈ $210,700 | +$120,700 |
| Year 15 | ≈ $26,500 | ≈ $337,400 | +$247,400 |
| Year 20 | ≈ $30,000 | ≈ $480,900 | +$390,900 |
| Year 25 | ≈ $33,900 | ≈ $641,500 | +$551,500 |
Read the table the way a CFO reads it: the asset crosses zero inside year five, then compounds for two decades with no additional capital beyond routine O&M and one probable inverter service event. No inventory risk, no customer concentration, no commodity exposure beyond the sun continuing to rise. That is why solar keeps winning internal capital-allocation fights against projects with flashier headline returns.
The Risks Worth Naming Out Loud
Honest analysis includes what can go wrong. Policy risk tops the list: incentive levels and net-metering rules are set by legislatures and commissions, and while the federal ITC has been remarkably durable, state-level export compensation has been revised downward in several major markets — model your project on current rules, not hoped-for ones. Execution risk follows: a solar project touches roofing, structural, electrical, and utility approval, and a weak link in any of them shows up as schedule slip. Technology risk is the mildest of the three but real — inverters fail, manufacturers exit markets, and a warranty is only as good as the company standing behind it at year twelve, which is why we steer buyers toward bankable brands with US service infrastructure. None of these risks is a reason to avoid commercial solar; each is a reason to buy it with diligence. The businesses that treat a solar proposal with the same rigor they would apply to any six-figure capital purchase are the ones whose projects deliver the numbers in this article.
Frequently Asked Questions
How much does a 100 kW commercial solar system cost? Turnkey pricing in the current market runs about $1.80–$2.40 per watt before incentives — $180,000 to $240,000 gross for 100 kW. After the 30% federal ITC and MACRS depreciation, most taxable businesses see net costs near $80,000–$110,000.
What is the payback period for commercial solar? In territories with commercial rates above $0.12/kWh and full incentive capture, simple payback typically lands between 4 and 7 years, with 25-year IRR commonly in the high teens.
Do solar panels work during a power outage? Standard grid-tie systems shut down during outages for safety. Pairing the array with battery storage and appropriate transfer equipment keeps critical loads running.
How much roof space does 100 kW need? Using modern 580W modules, 100 kW requires about 173 modules and roughly 6,500–7,500 square feet of usable roof or ground area, depending on tilt and row spacing.
Can a nonprofit claim the solar tax credit? Yes — the ITC now offers a direct-pay (elective pay) mechanism for tax-exempt entities, though the paperwork differs from a taxable business claiming the credit. Third-party PPA structures remain an alternative.
Does solar increase commercial property value? Under income-approach appraisal, reduced operating expenses capitalize into value at the property's cap rate. At a 7% cap rate, $10,000 of annual savings supports roughly $143,000 in value.