Commercial solar is not residential solar scaled up — it is a different financial instrument that happens to use similar hardware. Businesses buy electricity under demand-charge tariffs, depreciate capital equipment, pay taxes at corporate rates, and think in weighted average cost of capital rather than monthly budget. Those four differences mean the savings math that matters to a business owner is richer — and often dramatically better — than anything a homeowner sees. This guide walks the real numbers: what commercial systems cost per watt, how the 30% Investment Tax Credit and MACRS depreciation stack, how demand charges distort (and amplify) the value of a kilowatt-hour, and what a defensible payback model looks like in 2026.

I have quoted commercial arrays from a 40 kW system on a machine shop to a 500 kW carport installation for a distribution warehouse, and the pattern repeats every time: the owner who understands their tariff sheet before our first meeting gets a better system, because we spend the meeting engineering savings instead of explaining the bill.
What commercial solar costs per watt in 2026
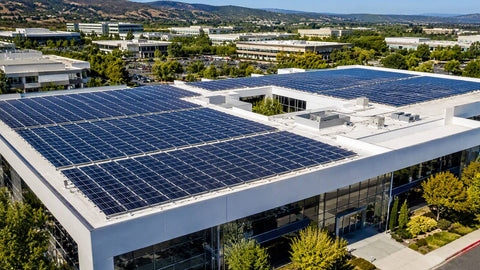
Commercial and industrial (C&I) systems benefit from scale economics that residential cannot touch: one mobilization instead of fifty, one permit set, engineered racking instead of attic crawls, and module purchases by the container instead of the pallet. Installed pricing for rooftop C&I projects in the 100 kW–1 MW range typically runs $1.60–$2.40 per watt before incentives, with carport and ground-mount structures adding $0.20–$0.60 per watt for steel and foundations.
| System scale | Typical installed cost ($/W) | Example project | Project cost (pre-incentive) |
|---|---|---|---|
| Small commercial (25–75 kW) | $2.20–$2.80 | 50 kW retail building rooftop | $110,000–$140,000 |
| Mid commercial (100–300 kW) | $1.90–$2.40 | 200 kW warehouse rooftop | $380,000–$480,000 |
| Large C&I (500 kW–1 MW) | $1.60–$2.10 | 750 kW distribution center | $1.2M–$1.58M |
| Carport / canopy structures | +$0.20–$0.60/W | 300 kW parking canopy | +$60,000–$180,000 vs. rooftop |
Those are turn-key numbers — engineering, equipment, labor, interconnection. Equipment alone (modules, inverters, racking, BOS) represents roughly 40–50% at commercial scale, which is why procurement discipline moves the needle: the same 750 kW project buys $40,000 cheaper when the module order is placed during a factory allocation dip. We track those dips; it is literally our business.
The incentive stack: ITC plus MACRS
Two federal mechanisms do the heavy lifting. The Investment Tax Credit (ITC) returns 30% of the installed cost as a dollar-for-dollar tax credit, with bonus adders (domestic content, energy community siting) that can push qualifying projects to 40–50%. Modified Accelerated Cost Recovery System (MACRS) depreciation then lets the business deduct the system's depreciable basis — conventionally 85% of cost when the ITC is claimed, since the basis is reduced by half the credit — over five years on an accelerated schedule, with bonus depreciation percentages applying per current tax law.
| Line item | Calculation | Value (500 kW, $950,000 project) |
|---|---|---|
| Installed cost | — | $950,000 |
| Federal ITC (30%) | $950,000 × 0.30 | $285,000 |
| Depreciable basis | $950,000 − ($285,000 ÷ 2) | $807,500 |
| MACRS value (21% corporate rate) | $807,500 × 0.21 (approx., accelerated) | ~$169,600 |
| Net effective cost, year 1–5 | Cost − ITC − MACRS value | ~$495,400 (52% of gross) |
A tax-paying business effectively pays about half the sticker price for a commercial array. This is the single most under-communicated fact in commercial solar: the customer who balks at $950,000 and the customer who understands they are really spending $495,000 are having two different conversations. Note the caveat that honest proposals always include: these benefits require tax appetite. Nonprofits, municipalities, and businesses without sufficient liability typically access the same economics through third-party ownership, leases, or direct-pay provisions instead.
Energy savings: the kilowatt-hour side
Production math at commercial scale is the same arithmetic as residential, with better capacity factors from professionally engineered tilt and spacing. A 500 kW system in a 5.0 peak-sun-hour region produces roughly 500 × 5.0 × 365 × 0.82 = 748,000 kWh in year one. Against a blended commercial energy rate of $0.11/kWh, that is about $82,300 per year of avoided purchases — before demand charges enter the picture.
| Region / peak sun hours | Year-1 production (500 kW @ 82% PR) | Energy value @ $0.09/kWh | Energy value @ $0.13/kWh |
|---|---|---|---|
| Southwest (6.0 hrs) | ~897,000 kWh | $80,700 | $116,600 |
| Texas / Southeast (5.0 hrs) | ~748,000 kWh | $67,300 | $97,200 |
| Midwest (4.2 hrs) | ~628,000 kWh | $56,500 | $81,600 |
| Northeast / Northwest (3.7 hrs) | ~553,000 kWh | $49,800 | $71,900 |
Degrade that output at 0.5% per year, escalate utility rates at a historically defensible 2.5–3.5% per year, and the energy savings alone carry a 25-year cumulative value between $1.9M and $3.4M for that 500 kW system — against a net cost under $500,000 after incentives. Even the pessimistic case is a multiple of the investment.
Demand charges: where commercial solar gets interesting
Most commercial tariffs charge not only for energy (kWh) but for peak demand (kW) — the highest 15-minute average draw in the billing cycle, at $8–$25 per kW depending on the utility. Demand charges commonly represent 30–50% of a commercial bill, and solar's ability to reduce them depends entirely on coincidence: does the array produce during the facility's peak? For daytime-peaking businesses — offices, schools, retail, manufacturing on day shift — the answer is usually yes, and solar shaves demand directly. For evening-peaking operations, solar alone misses the peak, and batteries become the demand-management tool.
| Facility profile | Peak window | Solar coincidence | Demand savings mechanism | Typical demand-charge reduction |
|---|---|---|---|---|
| Office / school | 10 AM–4 PM | High | Direct PV shave | 20–40% |
| Manufacturing, day shift | 8 AM–5 PM | High | Direct PV shave | 15–35% |
| Cold storage / 24-hr | Variable | Moderate | PV + controls | 10–25% |
| Restaurant / retail evening | 5–9 PM | Low | Battery discharge required | 5–15% (solar only) |
| Any + battery storage | Any | Engineered | Peak shaving at meter | 30–60% |
One warehouse customer of ours in the Southeast was paying $11,400 per month, of which $4,900 was demand charges on a 240 kW peak. Their 400 kW rooftop array cut the coincident peak to about 150 kW on sunny days — but demand charges bill on the month's single worst interval, and one cloudy Tuesday at shift change erased the whole month's savings. The fix was a 200 kWh battery with peak-shaving controls that cap the meter at 140 kW regardless of weather. Solar cut the energy charge; the battery cut the demand charge; neither alone did both. That pairing is the correct mental model for commercial savings engineering.
Payback and the 25-year picture
Energy Savings Over Time
Assemble the pieces for the 500 kW example in a $0.11/kWh, $15/kW-demand territory with good solar coincidence: net cost ~$495,000 after ITC and MACRS; annual energy savings ~$82,000; annual demand savings ~$28,000 (30% of a $93,000 annual demand bill); total first-year savings ~$110,000. Simple payback lands at 4.5 years — 6 to 7 years in weaker rate territories, 3 to 4 years in California or the Northeast's high-rate markets. Internal rates of return on well-sited commercial projects routinely model at 15–25%, which is why CFOs who run the numbers once tend to call back about their other buildings.
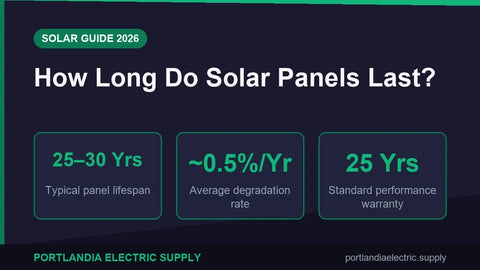
Two honest adjustments keep proposals credible. Production degrades ~0.5% annually, so year-20 savings run about 10% below year-1 in real output terms — but rate escalation typically outruns degradation two- or three-to-one. And inverter replacement reserves belong in the model: commercial string inverters carry 10-year warranties, so budget one mid-life replacement at roughly $0.04–$0.06 per watt in today's dollars. Proposals that omit both adjustments are marketing, not engineering.
Ownership structures beyond cash purchase
Cash purchase maximizes lifetime return but ties up capital. Loans preserve ownership economics with someone else's money — at current commercial rates, debt service on a 7-year loan often runs below the energy savings from month one, making the project cash-flow positive immediately. Power purchase agreements (PPAs) and leases put third-party-owned equipment on the roof: the business buys power at a discount to utility rates with zero capital outlay, trading maximum savings for zero risk and zero tax-appetite requirement. For non-taxpaying entities — schools, nonprofits, houses of worship — the PPA structure or direct-pay ITC provisions are usually the entire ballgame. We supply equipment across all three structures; the right answer is the one that matches the balance sheet, not the one that maximizes anyone's commission.
The interconnection timeline nobody budgets for

Equipment is available in weeks; utility interconnection takes months. A 500 kW commercial interconnect typically runs four to nine months from application to permission-to-operate, depending on the utility's study backlog and whether the local feeder needs upgrades. The sequence is unforgiving: application and feasibility study, system impact study if the feeder is congested, possible facilities study for upgrades, interconnection agreement, then construction, inspection, and PTO. Projects that order hardware before the impact study comes back occasionally discover the utility requires a $180,000 recloser upgrade that was not in the pro forma. The disciplined approach: file interconnection early, treat the impact-study results as a project gate, and keep equipment orders cancellable until the agreement is signed. I have watched a well-financed project die at that gate over a feeder upgrade that cost more than the racking; the owners who survive are the ones who price that risk before they fall in love with the rendering.
Roof due diligence before the panels
A commercial array is a 25-year tenant on a roof that may have ten years of life left. The pre-design checklist is short and non-negotiable. Get a roofer's assessment of remaining membrane life; if the roof has under ten years, re-roof first — the remove-and-reinstall cost of a commercial array mid-life runs $0.25–$0.45 per watt and erases a year of savings. Commission a structural review: modern ballasted systems add 4–6 pounds per square foot, mechanically attached systems less, and most commercial roofs designed to code carry it, but the letter from a structural engineer is what the permit office and the insurer both want to see. And walk the parapet shading at the winter solstice angle, not the summer one — a three-foot parapet that never shades in June throws a shadow across two rows of modules in December. These are cheap checks. Skipping them is how a good project becomes a cautionary tale at an industry conference.
Operations and maintenance at commercial scale
Commercial O&M is a line item, not an afterthought, and it prices at roughly $8–$15 per kW per year — call it $4,000–$7,500 annually for our 500 kW example. That buys scheduled inspections, IV-curve tracing or thermal drone scans that find dead strings and hot-spotted modules, inverter servicing, vegetation and soiling management, and the monitoring review that catches underperformance while it is still small. The economics justify themselves: a 2% undiagnosed underperformance on a system earning $110,000 a year is $2,200 annually of silent loss, every year, compounding with rate escalation. The portfolios that outperform their models are not the ones with the best modules; they are the ones whose monitoring reports get read by a human every month. We set every commercial customer up with alerting thresholds at commissioning and a simple rule: any string producing 10% below its peers for two consecutive weeks gets a site visit, no debate.
A worked 25-year cash flow, honestly stated
Pulling the whole model together for the 500 kW example: net cost $495,000 after ITC and MACRS; year-1 savings $110,000 growing at 3% rate escalation against 0.5% annual degradation, for a net escalation near 2.5%; O&M at $6,000 per year inflating at 2%; one inverter reserve event at year 12 costing $30,000. Simple payback arrives in year five. Cumulative 25-year net cash flow lands between $2.1M and $2.6M depending on realized rates — a 4–5× multiple on net cost with an IRR in the high teens. Sensitivity honesty: if rates escalate at only 1.5%, the multiple compresses toward 3.5×; if demand charges ratchet up as many utilities are filing, it stretches past 5×. There is no realistic scenario in the model where a well-sited, tax-advantaged commercial array loses money. The risks that actually hurt projects are execution risks — interconnection delays, roof problems, orphaned monitoring — which is why this article spends more words on process than on panels.
The electrical side at commercial scale
Commercial interconnection lives in NEC Article 705 like residential, but three-phase service changes the arithmetic and the hardware. A 500 kW inverter array on a 480 V three-phase service delivers 500,000 ÷ (480 × √3) = 601 A — a real feeder, not a breaker you buy at the supply house on a Saturday. The 120% rule of 705.12 still governs load-side connections, but at commercial scale supply-side taps are the norm: a fused disconnect ahead of the main, sized to the sum of sources. Voltage rise along long feeder runs becomes a design limit that residential never meets — inverters curtail when their terminals see voltage above 110% of nominal, and a 500 kW array pushing into a weak 800 A service at the end of a long run can curtail itself right out of its pro forma. The fix is conductor upsizing or multiple point-of-connection splits, both cheap at design time and painful after commissioning. Demand the voltage-rise calculation in every proposal you sign; two pages of engineering here save a season of curtailment there.
Where batteries enter the commercial picture
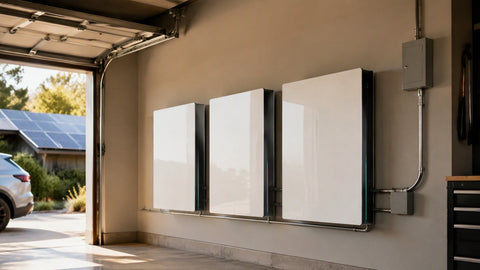
Commercial storage earns its place three ways, and a credible proposal names which one is doing the work. Demand-charge management is the most common: a battery dispatching against a 15-minute peak interval can cut demand charges 30–60% even where solar coincidence is poor. Energy arbitrage — charge on solar surplus or off-peak, discharge into peak windows — pencils where the spread exceeds roughly $0.10/kWh. And resilience, which defies ROI modeling but closes deals anyway for cold storage, data-dependent operations, and anyone who has priced a spoiled inventory event. C&I battery blocks in the 100–200 kWh class have fallen below price points that make the demand-management case alone work in $12+/kW demand territories; two years ago that threshold was $18. The crossover keeps moving in storage's favor, and proposals written even eighteen months ago deserve a fresh look.
Permitting realities at commercial scale
Commercial permitting adds two layers residential jobs never see. The fire code layer: IFC and local amendments dictate rooftop access pathways — typically three-foot clear walkways from eave to ridge and around roof hatches, plus smoke-vent clearances — and on a large flat roof these pathways can claim 15–25% of the area a naive layout assumed was available. Rapid shutdown under NEC 690.12 applies with module-level enforcement on most commercial rooftops, which is why module-level power electronics or certified transmitter-receiver pairs appear on nearly every commercial bill of materials now. The structural-electrical coordination layer: stamped drawings must show the racking attachment or ballast calculations alongside the single-line, and AHJs increasingly want the fire marshal's sign-off before plan check closes. Budget four to twelve weeks for permitting on commercial jobs and treat fire-layout review as a first-class design input, not a redline to absorb at the end. The fastest commercial projects I have supplied were the ones where the fire pathway drawing was done before the module count was finalized — everything else is rework.
Frequently asked questions
How much can a business save with commercial solar panels? A well-sited commercial system typically saves 50–75% of electricity costs. After the 30% federal tax credit and MACRS depreciation, most tax-paying businesses recover their net investment in 4–7 years and then capture 15–20 additional years of savings worth 3–5× the net cost.
What does commercial solar cost per watt? In 2026, turn-key commercial installations run $1.60–$2.40 per watt for systems from 100 kW to 1 MW, with smaller projects at $2.20–$2.80 and carport structures adding $0.20–$0.60 per watt for steel.
Does solar reduce demand charges? Only when production coincides with the facility's peak demand window. Daytime-peaking facilities see 20–40% demand-charge reductions from solar alone; evening-peaking facilities need battery storage with peak-shaving controls to move the needle.
How does MACRS depreciation work for solar? Businesses depreciate the system over five years on an accelerated schedule, on a basis reduced by half the ITC. At a 21% corporate rate, MACRS is typically worth 15–18% of gross project cost, stacking with the 30% credit to cut net cost roughly in half.
What size system does a typical business need? Divide annual kWh consumption by (local peak sun hours × 365 × 0.82). A business using 750,000 kWh per year in a 5-sun-hour region needs roughly 500 kW — about 1,150 modern 440 W modules on 25,000+ square feet of roof.
Can a nonprofit or school benefit from solar incentives? Yes, through direct-pay provisions for the ITC or through third-party ownership structures like PPAs, where a taxable entity owns the system and passes savings through as discounted power rates.
The bottom line
Commercial solar in 2026 is a finance decision executed with hardware: half-price net cost after incentives, four-to-seven-year paybacks, and demand-charge engineering that rewards understanding your own tariff. The businesses that capture the full value are the ones that model both sides of the bill — energy and demand — and size storage where the coincidence math says solar alone falls short. The technology is the easy part; the tariff sheet is where the money hides. Bring your last twelve months of interval data and your current tariff sheet to the first meeting, and the engineering does the rest. The projects that disappoint are almost always the ones that started from a brochure instead of a bill. I have yet to see a single commercial proposal built from real interval data that failed its board review; I have seen plenty built from square footage rules of thumb die in committee, and the difference is visible from the first slide. Data is the whole pitch, always, in every market, at every scale.
Portlandia Electric Supply equips commercial projects end to end: commercial solar panels, commercial inverters, string inverters, 100–200 kWh C&I batteries, racking and mounting, and utility-scale storage. Explore further: commercial solar installation costs, commercial & industrial energy solutions, solar ROI calculator, commercial procurement, financing options, and incentives by state.