Solar panels save most homeowners real money over their lifetime — our solar ROI calculator usually shows payback in seven to twelve years — but the technology is not magic, and pretending otherwise does buyers a disservice. Panels only generate in daylight, they lose a fraction of a percent of output every year, they demand a suitable roof, they cost five figures up front, and somebody eventually has to deal with them at end of life. This article walks through each disadvantage honestly, with the actual numbers we use on job sites, and then shows the engineering and financial mitigations that make solar a sound purchase anyway for most properties.
None of what follows is a reason to avoid solar categorically. It is a checklist for deciding whether solar fits your roof, budget, and expectations — and for sizing a system so the disadvantages stay small instead of expensive.
1. Intermittency: panels only work when the sun does
The single biggest physical limitation of solar is that output follows the sun. A panel rated at 450 watts produces that only under standard test conditions — 1,000 W/m² of irradiance at 25°C cell temperature. Real-world output swings with season, cloud cover, and time of day, and it drops to zero every single night. A typical residential array in the Pacific Northwest might deliver a capacity factor of 15–18% annually; the same hardware in Arizona reaches 22–26%. That means an 8 kW array is really an average 1.2–2.1 kW machine spread across the year, concentrated in midday hours.
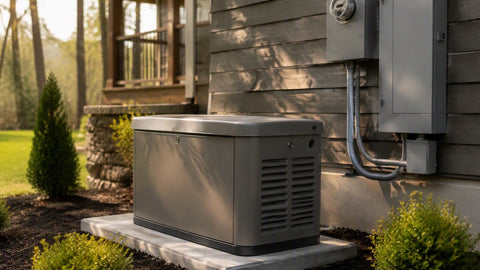
The practical consequence: a grid-tied home still depends on the utility at night and during long cloudy stretches, and a grid outage shuts down a standard grid-tied inverter too — anti-islanding protection required by code means your panels go dark during a blackout unless you have battery storage or a backup-capable hybrid inverter.
The mitigation math
There are three standard ways to blunt intermittency, and they stack:
- Net metering. Where your utility offers full retail net metering, the grid acts as a free battery: overproduction at noon banks credits that offset consumption at night. This eliminates most of the intermittency penalty on an annual basis, though it does nothing during outages.
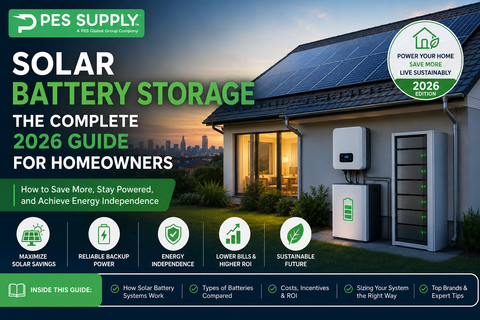
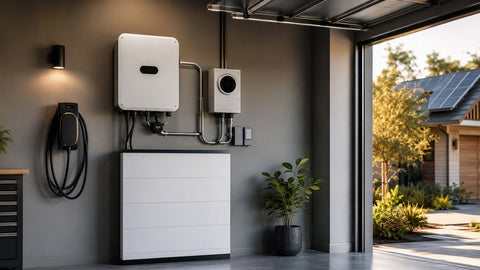
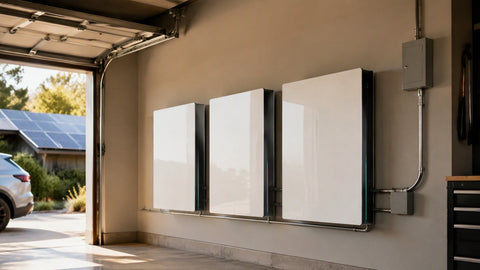
- Battery storage. A battery absorbs midday surplus and releases it after sunset. Our solar battery sizing guide walks the full calculation, but the short version: a home using 30 kWh/day with evening-heavy loads typically needs 10–20 kWh of usable storage to shift solar into the evening peak. Lithium iron phosphate packs in our LiFePO4 battery lineup deliver 6,000+ cycles, which is why they dominate new installations.
- Load shifting and smart controls. Running the dishwasher, water heater, and EV charger during solar hours costs nothing in hardware and can raise self-consumption from roughly 30% to 50–60% before you buy a single battery cell.
Worked example: an 8 kW array producing 32 kWh on a summer day, in a home using 30 kWh/day. Without storage, perhaps 9 kWh is consumed live and 23 kWh is exported at whatever your utility pays. Add a 13.5 kWh battery and you shift most of that surplus into the 5–9 p.m. window, where time-of-use rates in many territories run two to three times the off-peak price. The battery does not create energy — it moves it to where it is worth more.
Installer note: The most common surprise I see on first-year production reports is not low output — it is a shape problem. The system makes plenty of kWh, but the family's meter bill stays high because everyone showers, cooks, and charges the car after dark. Before I quote storage, I pull twelve months of interval data and check whether the utility's export rate is punishing. If the customer has 1:1 net metering, I often tell them to skip the battery for now and revisit it if rates change. Selling storage to someone who does not need it is how this industry earns bad reviews.
2. Degradation: every panel is slowly dying from day one
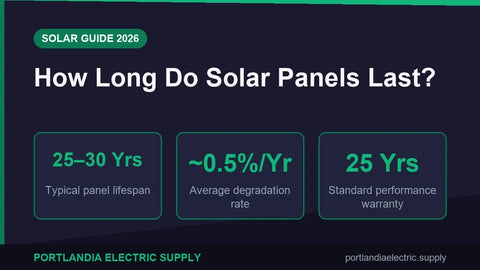
Solar cells degrade through several mechanisms: light-induced degradation (LID) in the first hours of sun exposure, potential-induced degradation (PID) from voltage stress, UV-driven discoloration of encapsulants, microcrack propagation from thermal cycling, and corrosion at interconnects. The result is a slow, mostly predictable decline in output that never stops.
The good news is that modern degradation rates are genuinely small, and they differ meaningfully by cell technology. The table below models a 10 kW nameplate system using published first-year and annual degradation figures for each mainstream technology:
| Technology | First-year loss (LID) | Annual degradation after year 1 | Year 1 output | Year 10 output | Year 25 output | Year 30 output |
|---|---|---|---|---|---|---|
| Mono PERC (p-type) | 2.0% | 0.55% | 98.0% | 93.1% | 84.8% | 82.1% |
| N-type TOPCon | 1.0% | 0.40% | 99.0% | 95.4% | 89.4% | 87.4% |
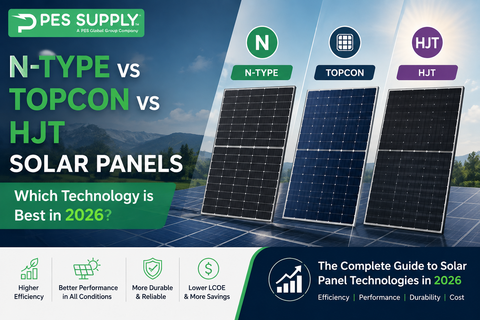
| HJT (heterojunction) | 1.0% | 0.25% | 99.0% | 96.8% | 93.0% | 91.8% |
| Thin-film CdTe | 1.0% | 0.50% | 99.0% | 94.5% | 87.0% | 84.5% |
Reading the math: for mono PERC, year 10 output is 98.0% − (9 × 0.55%) = 93.05%, and year 25 is 98.0% − (24 × 0.55%) = 84.8%. That 84.8% figure is exactly why mainstream PERC modules carry a 25-year performance warranty guaranteeing roughly 84–85% of nameplate. N-type TOPCon panels degrade slower because n-type silicon resists the boron-oxygen defects that drive LID in p-type cells, and HJT modules add amorphous silicon layers that passivate the surface better than anything else in mass production.
What degradation costs you in dollars: on a system producing 12,000 kWh in year 1 at a $0.17/kWh avoided rate, the difference between PERC (82.1% at year 30) and HJT (91.8%) is about 1,164 kWh in year 30 alone — roughly $198 that year, and a cumulative gap over three decades of roughly $2,500–3,000. That is real money, but it is a fraction of total lifetime production, and premium panel prices often exceed the gap. Degradation is a reason to buy decent equipment from a real warranty program, not a reason to panic.
Installer note: I tell every customer the same thing at commissioning: screenshot your monitoring app in month one and save it. Degradation is gradual enough that nobody notices year to year, but I have settled two warranty claims where that baseline screenshot was the only proof a string had fallen off a cliff at year eight — in both cases the culprit was PID on a budget module, not normal aging. Nameplate warranties are only as good as your documentation. For production expectations across seasons, our whole-house solar analysis shows what annual output actually looks like.
3. Roof constraints: your house may simply not cooperate
Solar needs unshaded, structurally sound, correctly oriented space — roughly 17–22 square feet per 400-watt panel once you account for setbacks. The constraints stack up fast:
- Orientation and tilt. In the northern hemisphere, south-facing at a tilt near your latitude is ideal. East and west faces lose about 15–20% of annual yield; north-facing planes lose 30% or more and are rarely worth mounting on at all.
- Shading. Trees, chimneys, vent pipes, and neighboring buildings are the silent killers. Because cells in a module — and modules in a string — are wired in series, a small shadow can drag down a disproportionate share of production.
- Roof condition. Panels last 25–30 years. If your shingles have less than 10–12 years of life left, reroof first; removing and reinstalling an array for a mid-life reroof runs $1,500–$4,000 depending on system size.
- Structure. Asphalt-shingle roofs on standard trusses handle the ~3 psf added load of panels and racking easily. Flat concrete tile, slate, and old skip-sheathing roofs need engineering review and sometimes reinforcement.
- Fire code setbacks. Most jurisdictions following the International Fire Code require 3-foot ridges setbacks and access pathways, which can shrink usable roof area 20–30% on chopped-up rooflines.
Shading loss percentages: why one branch can cost you 300 watts
The table below models a 5 kW, ten-panel string on a clear summer day, comparing a traditional string inverter against module-level power electronics (MLPE) — microinverters or DC power optimizers:
| Share of one panel shaded | Equivalent array area affected | String inverter output loss | Microinverter/optimizer output loss |
|---|---|---|---|
| 10% of one panel | ~1% of array | 5–10% (bypass diodes cut one third of the panel) | ~1% (only the shaded cells lost) |
| 50% of one panel | ~5% of array | 10–15% | ~5% |
| One full panel shaded | 10% of array | 15–30% (string current pulled down) | ~10% |
| Three panels fully shaded | 30% of array | 35–50% | ~30% |
| Half the array shaded | 50% of array | 60–85% (inverter may drop offline below minimum voltage) | ~50% |
The physics behind the string-inverter column: panels in a string share one current. Shade one panel and its bypass diodes route around it, but string voltage drops and the inverter's maximum power point tracker hunts for a compromise operating point — often settling where the unshaded panels underperform too. MLPE devices give each panel its own tracker, so losses stay roughly proportional to the shaded area. On heavily shaded roofs, microinverters routinely recover 10–25% more annual energy than a string design, which can be the difference between a project that pencils and one that does not. For more on array layout, see our guide to wiring solar panels and the system size calculator.
Installer note: The worst site I ever surveyed had a beautiful south roof — and a mature Douglas fir planted eighteen feet south of the ridgeline. From October through February the tree shadow swept across the entire array between 10 a.m. and 2 p.m. The homeowner had been quoted a 9 kW system by two other companies with no shade analysis at all. We modeled it with a shade tool, showed them 34% winter losses, and downsized to 5.5 kW on the east-west garage planes instead. They make less power than the fantasy quote promised, but they make what we said they would. Under-promise and over-deliver is the only sustainable strategy in this trade.
4. Upfront cost: the check you write before the savings start
Solar's economics are back-loaded: nearly all the cost lands on day one, and nearly all the benefit arrives over the following 25–30 years. That structure alone disqualifies the technology for households without capital or financing access, and it makes the purchase sensitive to interest rates in a way utility bills never are.
Here is a realistic installed cost breakdown for an 8 kW residential system at $2.80 per watt, a typical figure for the U.S. market:
| Cost component | Amount | Share of total | Notes |
|---|---|---|---|
| Modules (20 × 400 W) | $4,000 | 17.9% | ~$0.50/W for quality tier-1 glass |
| Inverter(s) | $2,200 | 9.8% | String unit or 20 microinverters |
| Racking and mounts | $1,600 | 7.1% | Rails, clamps, flashing, attachments |
| Electrical BOS | $1,800 | 8.0% | Wire, conduit, disconnects, breakers, rapid shutdown |
| Labor | $5,600 | 25.0% | 2–3 installers, 2–3 days plus electrician |
| Permitting, inspection, interconnection | $1,700 | 7.6% | AHJ fees, engineering stamps, utility application |
| Overhead, sales, and margin | $5,500 | 24.6% | Varies wildly by installer business model |
| Gross total | $22,400 | 100% | $2.80/W before incentives |
| After 30% federal tax credit | $15,680 | — | $1.96/W net |
The components sum to $4,000 + $2,200 + $1,600 + $1,800 + $5,600 + $1,700 + $5,500 = $22,400, and the 30% credit returns $6,720, leaving $15,680 net. Notice what dominates: not the panels. Hardware is now under 35% of a residential price; soft costs — labor, permitting, overhead, and customer acquisition — are the majority. That is why U.S. residential solar costs two to three times more per watt than identical hardware installed in Australia, and why shopping multiple quotes matters more than haggling over panel brand. Our commercial installation cost breakdown shows how the same math scales up, and state-by-state incentives can shift the net price further — see the solar incentives by state guide.
Financing changes the picture substantially. A $15,680 net cost financed over 20 years at 7% APR costs about $121/month and roughly $13,500 in total interest — which can erase half the lifetime savings if your utility rate is low. Cash buyers capture the full value; loan buyers should compare the payment against their current average bill line by line. Lease and PPA structures avoid the upfront check entirely but typically cost 20–40% more over the term than ownership and complicate home sales.
5. Recycling and end of life: a waste stream the industry is still building
Crystalline silicon panels are about 75% glass by weight, and most of the rest is aluminum, polymer, silicon, and copper — all technically recyclable. The problem is economics and infrastructure, not chemistry. A retired panel contains roughly $3–5 of recoverable material, while proper recycling costs $10–25 per module today. That gap means many decommissioned panels still end up landfilled or stacked in warehouses, and the U.S. has no federal recycling mandate for PV. The International Renewable Energy Agency projects cumulative global PV waste could reach 60–78 million tonnes by 2050 — a serious stream that today's recycling capacity cannot absorb.
Material recovery rates achievable with current best-practice processing:
| Material | Share of module mass | Achievable recovery rate | Recovered output per 20 kg module | End market |
|---|---|---|---|---|
| Glass | ~75% | 90–95% | 13.5–14.3 kg | Container glass, fiberglass, new panel glass |
| Aluminum frame | ~10% | 95–100% | 1.9–2.0 kg | Fully recirculated into aluminum stock |
| Polymers (backsheet, encapsulant) | ~10% | 0–20% | 0–0.4 kg | Mostly incinerated for energy recovery today |
| Silicon cells | ~3.5% | 80–85% | 0.56–0.60 kg | Downcycled to metallurgical silicon; closed-loop refining emerging |
| Copper (wiring, ribbon) | ~1% | 85–90% | 0.17–0.18 kg | Standard copper scrap stream |
| Silver (contacts) | ~0.05% | 75–90% with dedicated refining | 7.5–9 g | High-value; drives advanced recycling economics |
Adding the realistic middle of those ranges, a 20 kg module yields roughly 14 kg of glass, 2 kg of aluminum, 0.6 kg of silicon, 0.18 kg of copper, and about 8 grams of silver — around 17 kg, or 85% of the module by mass, returned to productive use. The polymer fraction is the weak link, which is one reason dual-glass modules are gaining share: replacing the polymer backsheet with glass raises the recyclable mass fraction and improves fire ratings at the same time.
The mitigation here is mostly policy and procurement: the EU's WEEE directive already mandates producer-funded PV take-back, Washington State requires manufacturer stewardship plans, and several U.S. recyclers now operate dedicated PV lines. If end-of-life responsibility matters to you, buy from manufacturers with published take-back programs and keep your bill of sale — the recycler will ask what they are handling.
6. The disadvantages nobody puts in the brochure
Beyond the big five, a handful of smaller frictions deserve honest mention:
- Aesthetics are subjective but real. Black-frame all-black panels on flush racking look far better than the silver-and-blue arrays of a decade ago, but some HOAs and some homeowners simply dislike the look, and historic districts may prohibit street-facing arrays outright.
- Roof penetrations. A properly flashed attachment with quality sealant should never leak, and we warranty ours, but every penetration is a maintenance point. Ballasted flat-roof systems avoid penetrations at the cost of added weight.
- Insurance and appraisal complexity. Some carriers raise premiums slightly; some appraisers credit solar at far below its cost; leased systems can spook buyers and slow closings. Owned systems with documented production data fare much better — multiple studies peg resale value gains around $4 per installed watt, but your mileage varies by market.
- Equipment obsolescence. Inverters carry 10–25 year warranties, shorter than the panels they serve, and manufacturers do fail. Budget for one inverter replacement ($1,500–$3,000 installed) during the array's life unless you choose microinverters with 25-year coverage. Our solar inverter overview compares the architectures.
- Weather exposure. Quality modules are tested to survive 1-inch hail at 50+ mph and wind loads well beyond code minimums, but golf-ball hail and tornadoes still destroy arrays. Panels are usually covered under homeowner's insurance — confirm before the storm, not after.
- Moving means starting over. Panels are not portable. If you expect to move within five years, the payback math rarely works unless the sale price captures the system's value.
7. When solar genuinely is the wrong choice
After years of site surveys, the clear disqualifiers are consistent:
- A roof that will need replacement within a decade and no budget to reroof first.
- Shading losses above 25–30% even after tree work and MLPE — common in wooded lots and dense urban canyons.
- Utility rates below roughly $0.10/kWh with no net metering, where payback stretches past 20 years even at today's hardware prices.
- An imminent move, as noted above.
- Structural or electrical service limitations — a 100-amp panel already maxed out, or a roof that cannot take the load — where upgrade costs break the budget. Our guides on upgrading electrical service and system components cover what those upgrades involve.
In those situations, honest alternatives exist: community solar subscriptions, green tariffs from your utility, efficiency upgrades with faster payback, or simply waiting for a reroof to align the timing. A good installer will tell you to walk away when the numbers do not work, because a bad solar sale eventually becomes a bad review and a warranty headache.
8. The balanced bottom line
Solar's disadvantages are real, quantifiable, and mostly manageable. Intermittency is solved contractually by net metering or physically by battery storage. Degradation costs a few tenths of a percent per year and is priced into every serious proposal. Roof constraints are knowable before you sign anything, provided someone actually performs a shade analysis. Upfront cost is softened by the 30% federal credit and state programs, though financing terms deserve the same scrutiny as the equipment. End-of-life recycling is the industry's least-solved problem, but the material stream is valuable enough that capacity is being built, and today's panels will not retire for decades anyway.
The technology rewards homework. Get multiple quotes, demand a production estimate with stated assumptions, check current panel comparisons rather than last decade's brand lore, and run your own numbers through a system calculator before letting anyone size your array. Done right, solar's disadvantages shrink to line items in a spreadsheet; done carelessly, they become twenty-five years of underperformance on your roof.
Frequently asked questions
Do solar panels work on cloudy days or at night?
Panels produce 10–25% of rated output under heavy overcast and nothing at night. Grid-tied systems cover the gap through net metering credits; off-grid and backup systems use batteries. Intermittency is the core design constraint of every solar system, which is why production estimates are quoted as annual totals rather than daily guarantees.
How much power do solar panels lose each year?
Mainstream mono PERC panels lose about 2% in year one, then 0.5–0.55% annually, reaching roughly 85% of nameplate at year 25. N-type TOPCon averages 0.4% per year and HJT about 0.25%, so premium technologies retain 87–93% at the same age. All reputable manufacturers warranty these floors.
Is solar worth it if my roof is partially shaded?
It depends on where and when the shade falls. Module-level electronics — microinverters or DC optimizers — keep losses roughly proportional to the shaded area instead of letting one shadow drag down a whole string. If modeled annual losses stay under about 25% after mitigation, the project usually still pencils; above that, consider trimming trees or skipping the shaded planes.
What happens to solar panels at the end of their life?
A crystalline module is about 75% glass and 10% aluminum, and best-practice recycling recovers roughly 85% of total mass, including copper and silver. U.S. recycling infrastructure is still maturing and there is no federal take-back mandate, so choose manufacturers with published stewardship programs and keep your purchase records.
Will solar panels damage my roof?
Properly flashed and sealed attachments should not leak, and panels actually shield the roof section beneath them from UV and weather, often extending shingle life there. The real risk is installing over a roof that is already near end of life — removing and reinstalling an array for a reroof costs $1,500–$4,000, so reroof first if your shingles have under ten years left.
How much does a residential solar system really cost after incentives?
An 8 kW system at a typical $2.80/W runs $22,400 gross and $15,680 after the 30% federal tax credit, with state and utility incentives lowering it further in some markets. Financing adds interest that can consume a third to half of lifetime savings, so compare loan terms against your actual utility rate before signing.