The first half of 2026 gave the solar industry a strange combination: record global installations alongside a sharp U.S. quarterly contraction, module prices stabilizing after a two-year collapse, and a policy calendar that's compressing procurement decisions into hard deadlines. This outlook pulls together what we're seeing in pricing, supply chain composition, and demand signals heading into the back half of 2026 — written from the perspective of people who quote this equipment daily, for the contractors and buyers who have to make purchasing decisions in it.
Q1 2026 Installation Data: A Sharp Decline
U.S. solar installations dropped meaningfully in Q1 2026, with utility-scale taking the hardest hit after two years of record pull-forward:
| Segment | Q1 2026 Capacity | Year-over-Year Change | Quarter-over-Quarter Change |
|---|---|---|---|
| Utility-scale | 5.9 GWdc | -34% | -45% |
| Residential | 1,179 MWdc | +6% | -15% |
| Commercial | Modest decline | Varies by region | Down |
Context matters: the Q1 decline follows the massive 2025 safe-harbor pull-forward, where developers rushed to begin construction ahead of tax credit changes. Residential is the quietly interesting number — up 6% year over year despite high financing costs, driven almost entirely by storage attachment and third-party ownership structures that work under post-NEM-3.0-style economics. Our 2026 H1 industry recap covers the demand side in detail.
Module Pricing: A Two-Track Market
U.S. module pricing has settled into a narrow band after years of freefall, but "the price of modules" now depends heavily on which market you're buying in:
| Metric | Value |
|---|---|
| Median price | $0.30/W |
| Interquartile range | $0.280/W – $0.325/W |
| Modules tracked | 55 modules from 19 suppliers |
| Q1 2026 median | $0.28/W |
| Price movement (Mar–Apr 2026) | -$0.015/W dip |
| Price movement (May 2026) | +$0.005/W recovery |
| June–July trend | Held flat |
The $0.28 → $0.30/W drift looks minor until you annualize it: on a 500 kW commercial job, two cents per watt is $10,000. Meanwhile the international market tells a completely different story:
| Market | Module Price | Trend |
|---|---|---|
| China TOPCon (average) | RMB 0.72/W | Down 1.1% |
| China ground-mount TOPCon | RMB 0.70/W | Down 1.4% |
| China-made TOPCon for Europe | $0.121/W FOB | Down 3.5% |
| India-assembled TOPCon FOB | $0.145/W | Unchanged |
| Europe full-black modules | €0.129/Wp | Premium holding |
| Europe back-contact modules | €0.135/Wp | Premium holding |
A U.S. buyer paying $0.30/W is paying roughly 2.5× the FOB China price for a comparable TOPCon module. That gap is not manufacturing cost — it's tariff stacking, compliance overhead, and domestic content scarcity value. The full mechanics are in our 2026 module sourcing analysis, and the tariff timeline behind it is in what installers need to know about 2026 tariffs.
Polysilicon Supply: Record Oversupply
The upstream picture keeps a lid on any price spike scenario. Global polysilicon capacity still exceeds demand by a wide margin, even after Chinese capacity discipline agreements took some marginal production offline. Wafer and cell capacity likewise remain long. For buyers, this means module price risk in H2 2026 is asymmetric: limited upside from supply shocks, real downside only if trade policy tightens further. The Section 232 polysilicon action — tracked in our Section 232 polysilicon tariff coverage — is the one supply-side wildcard that could push domestic module costs up regardless of the global glut.
U.S. Supply Chain Composition
Where modules actually come from has shifted dramatically. The current U.S.-market module supply chain by input origin:
| Component | Origin Breakdown |
|---|---|
| Polysilicon | Malaysia: 24 modules; U.S.: 15 modules; China: 13 modules; other: 3 modules |
| Cells | 10 different countries; Kenya: 12 modules; Philippines: 11 modules; others distributed |
Two things stand out to anyone who remembers the 2022 supply chain. First, U.S. polysilicon now feeds a meaningful share of modules sold here — the domestic manufacturing build-out is real at the raw material end. Second, cell production has scattered across ten countries as manufacturers chase tariff-free pathways, with Kenya and the Philippines emerging as unexpected cell hubs. Whether those routes survive the next AD/CVD round is an open question — the trade lawyers are busy, and our coverage of UFLPA supply chain disruption shows how fast a sourcing route can close.
System Pricing Trends
Module stabilization hasn't translated into system-level relief because balance-of-system and soft costs keep climbing. Labor is the biggest driver — the installer and electrician shortage we covered in the 2026 workforce crisis analysis is pushing installation labor up 5–8% annually in tight markets. Racking, wire, and electrical BOS are up modestly; the racking and mounting category has seen steel-price-driven increases of a few percent. The result: residential system prices are roughly flat year over year even with cheaper modules, while commercial EPC pricing is up 2–4%.
IRA Incentive Impact on Demand
The incentive calendar is now the single biggest demand driver in the U.S. market. Four deadlines are shaping H2 2026 behavior:
| Deadline | Significance |
|---|---|
| July 4, 2026 | Safe harbor deadline to begin construction and preserve 30% ITC eligibility under Section 48E |
| December 31, 2026 | Treasury due to issue final safe harbor tables for domestic content calculations |
| January 1, 2027 | FEOC threshold increases to 45% for PV, 60% for battery |
| December 31, 2027 | Final deadline to energize projects for nonprofit safe harbor qualification |
The July 4 safe harbor date already pulled commercial demand into H1 — part of why Q2 order books looked strong while Q1 installations lagged. Residential buyers face their own cliff with the residential credit sunset, detailed in our ITC safe harbor and residential credit sunset guide. If you're a contractor, the message is blunt: customers sitting on quotes have a deadline, and the deadline is a selling tool you should be using honestly.
Demand Forecast for H2 2026
Our read on the back half: residential continues slow growth, storage-led, with attachment rates pushing past 50% of new installs in key markets. Commercial surges into Q4 as safe-harbored projects execute and buyers race the FEOC threshold increase. Utility-scale stays lumpy — interconnection queues, not demand, are the binding constraint, as we detailed in the interconnection backlog analysis. On the equipment side, hybrid inverters and LFP storage remain the tightest categories; standard modules are long and will stay long.
Procurement Strategies for H2 2026
Four practices separate buyers who'll land equipment on time at fair prices from those who won't:
1. Diversify module sources. Qualify at least two manufacturers per project spec — one domestic-content-eligible, one best-value import — so a single AD/CVD determination or FEOC ruling can't strand your pipeline. Browse what's actually available across the solar panel catalog rather than assuming last year's brand mix.
2. Lock pricing with short validity windows. Quote validity has compressed from 90 days to 14–30 days at many suppliers. Budget projects at quoted prices plus a 3–5% contingency, and execute purchases promptly after award.
3. Prioritize FEOC-compliant inventory now. With the PV threshold rising to 45% in January 2027, compliant modules, inverters, and batteries will command growing premiums through H2. Inventory bought before the rush prices better than inventory bought during it.
4. Plan delivery timelines conservatively. Domestic module lead times run 8–16 weeks for large orders; hybrid inverters can stretch further. Sequence procurement ahead of your installation calendar, not behind it.
What This Means for Installers
From our side of the counter, the installers navigating 2026 best share three habits: they quote with validity dates and escalation language, they keep relationships with more than one equipment supplier, and they've built storage into their standard offering rather than treating it as an exotic add-on. The equipment is available — Fronius inverters, modules, racking, storage — but pricing and compliance windows reward decisiveness. If you want a wholesale quote on a specific bill of materials, our quote desk turns most BOMs around in a business day.
How We Got Here: Module Prices, 2022–2026
The stability of 2026 pricing only makes sense against the crash that preceded it. Here's the arc we've quoted through:
| Period | U.S. Module Price Level (approx.) | What Drove It |
|---|---|---|
| 2022 | $0.40–0.50/W | UFLPA enforcement, supply chain crisis, polysilicon shortage |
| 2023 | $0.30–0.40/W | Polysilicon capacity flood; price collapse begins |
| 2024 | $0.25–0.32/W | Global overcapacity deepens; Chinese prices below cash cost |
| 2025 | $0.26–0.30/W | Tariff rounds stack; domestic content premium emerges; prices stabilize |
| H1 2026 | $0.28–0.325/W | Two-track market: tariff-protected U.S. vs. glutted global |
I quoted modules at nearly double today's prices four years ago and customers bought every pallet we could land. The lesson that stuck with me: buyers who waited for the "bottom" in 2023 and 2024 kept moving the goalposts while paying full utility rates — the best procurement strategy has never been timing the market, it's buying well when the project is ready.
Storage: The Demand Engine Hiding in Plain Sight
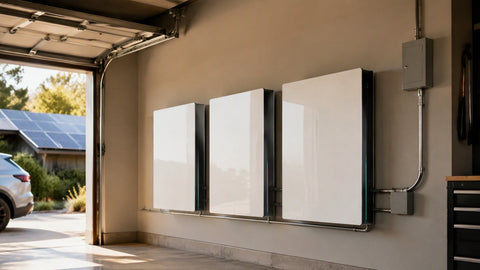
Every demand forecast that matters in H2 2026 runs through storage. Residential attachment rates passed 50% in key markets; commercial storage is the fastest-growing quote category we see; utility-scale storage pipelines exceed solar-only pipelines in several interconnection queues. LFP cell supply is ample and prices keep drifting down, which means the constraint is increasingly hybrid inverter availability and installer labor, not batteries themselves. For equipment planning, that means booking hybrid inverters and storage earlier in your project cycle than you're used to — the lead times on those categories, not modules, are what slip schedules now.
PPA and PPA-Adjacent Pricing: Where the Money Clears
Module prices tell you about equipment; PPA prices tell you about projects. Utility-scale PPA prices have drifted upward through 2025–2026 as interconnection costs, labor, and financing overwhelmed module deflation — a useful reminder that modules are now a minority of project cost. For offtakers, the market bifurcates: safe-harbored projects with secured equipment command premium PPA prices because they're certain, while speculative projects price lower with schedule risk attached. Corporates procuring clean energy for data center load — the demand story of the decade — increasingly sign hybrid solar-plus-storage PPAs that price firm capacity rather than raw energy. If you're evaluating a PPA offer, compare it against the levelized math of owning the system: at current commercial equipment prices, ownership with the ITC and MACRS frequently beats PPA pricing by 15–25% over the term for creditworthy businesses.
What Smart Contractors Are Stocking This Fall
I've watched three inventory strategies play out across our contractor base this year, and the results are in. The winners stocked hybrid inverters and LFP batteries ahead of demand — both categories ran allocation-tight in Q2, and shops with shelves full took jobs from shops with lead times. They dual-sourced modules, holding a domestic-content line and a value import line so every project type had an answer. And they kept racking and wire in depth, because BOS shortages idle crews just as completely as panel shortages do. The losers ran just-in-time on everything to protect cash, then watched two-week promises become eight-week realities. With the FEOC step-up in January and safe-harbor-driven Q4 demand ahead, the stocking decision isn't cautious — it's the strategy.
Regional Demand Notes
Demand is geography now. Texas and the Southeast keep adding utility-scale volume on the strength of load growth and workable interconnection. California's residential market has fully restructured around storage-attached third-party ownership — volumes below the 2022 peak but stable. The Northeast residential market rides high electricity rates and strong state programs. The Midwest is the sleeper: cheap land, rising rates, and improving state policy are pulling commercial and community solar into states that barely had markets five years ago. The Pacific Northwest grows steadily on commercial and residential retrofits, with utility-scale constrained by transmission more than demand. Match your business plan to your region's driver — national averages describe a market that doesn't exist.
Equipment Availability Snapshot: What's Tight and What's Long
Procurement decisions live or die on availability, so here's the supply picture as we see it from the wholesale side entering H2 2026:
| Category | Availability | Lead Time Signal |
|---|---|---|
| Standard import modules | Long — ample supply | 2–6 weeks; spot deals available |
| Domestic-content-eligible modules | Tightening | 8–16 weeks and stretching toward the 2027 FEOC step-up |
| Hybrid inverters | Tight | 4–10 weeks; allocation events in Q2 |
| String inverters | Normal | 2–4 weeks across major brands |
| LFP battery systems | Normal to tight by brand | Value brands 2–6 weeks; premium brands longer |
| Racking and BOS | Normal | 1–3 weeks; steel pricing stable |
Read the second and third rows together: the two categories every 2027-compliant project needs are the two that are tightening. That's not a coincidence, and it's not going to improve before the January deadline. The contractors I worry about are the ones planning to buy domestic-content modules in December.
The Financing Climate Behind the Demand Numbers
Demand forecasts are really financing forecasts. Residential loan rates in the 6.5–8.5% range keep the cash-sale and third-party-ownership shares elevated; every quarter-point of rate relief reopens a slice of the loan market. Commercial projects live on tax equity and debt spreads, and the transferability market's discount — still roughly 8–12 cents on the credit dollar — quietly taxes every transaction. Watch the rate environment through H2: it's the one variable that can move residential demand 10% either way without a single policy change, and it will decide whether the safe-harbor cliff is followed by a soft landing or a hard one.
Interconnection: The Constraint Behind the Constraint
Ask a utility-scale developer what limits their H2 2026 pipeline and you won't hear "modules" or "capital" — you'll hear "queue position." Interconnection wait times in major ISOs run three to five years, and the reform packages moving through FERC and the RTOs will help 2028 more than 2026. For buyers, the interconnection crunch has a practical equipment consequence: projects that hold queue positions and signed agreements are safe-harboring equipment purchases earlier and holding inventory longer, which pulls domestic-content modules and transformers forward in the supply chain. When a developer tells you their COD slipped, the sympathetic follow-up is asking about their queue status — nine times out of ten, that's the real story, and the equipment order follows the study, not the calendar.
Reading the Signals Into Q4
Three indicators will tell you where the market actually goes this fall, all trackable without an analyst subscription. First, distributor quote validity windows: if they shorten again, supply is tightening faster than prices show. Second, domestic module lead times: stretch past 16 weeks and the FEOC rush is on. Third, residential third-party-ownership share: rising TPO share signals rate pressure persisting, falling share signals the loan market healing. We watch all three from the wholesale desk because they predict our order book — and they'll predict yours.
A Note on Data Quality
Market outlooks are only as honest as their inputs, so a word on ours. Pricing figures here blend published price indexes with what we actually quote and pay at the wholesale desk — where they diverge, we've noted ranges rather than false precision. Installation data lags by a quarter or more, and segment definitions differ between trackers, so treat single-digit gigawatt comparisons across sources with care. Tariff and policy dates are the most solid numbers in this piece, and even they carry rulemaking risk. The posture we recommend — diversify sourcing, shorten quote validity assumptions, buy compliance-eligible equipment early — is designed to be right under every plausible version of the next six months, not just the base case.
Residential Buyers in H2 2026: Timing the Decision
If you're a homeowner reading a market outlook, the translation is short. Equipment is available and priced near historic floors; the federal credit's future is the variable you control least and should respect most; and installer calendars fill in Q4 as deadlines approach. The best residential buying window of the year is typically late summer — before the Q4 rush compresses install schedules and quote validity. Lock your design, verify your installer's equipment pipeline, and get on the calendar. The market forces in this article move your price by single-digit percentages; waiting a year moves it by a full year of utility bills.
The One-Sentence Version
For everyone who skipped to the end: global supply is long, U.S. prices are tariff-supported and stable, compliance-eligible equipment is tightening steadily into 2027, and the buyers who plan procurement backward from the policy calendar will consistently beat the buyers who shop spot prices and hope. That's H2 2026 in one single, complete, evidence-backed sentence — the rest of this article is just the evidence, and the sections above give you the data and tables to act on it — whether you're stocking a warehouse, pricing a commercial bid, or deciding when to sign a residential quote.
For context on how this half-year fits the longer arc, our 2025 H1 retrospective covers the policy shifts that set the current deadlines in motion, and the patterns there — pull-forward demand, compliance-driven sourcing, storage's steady rise — are the same ones still actively driving the market right now.
Frequently Asked Questions
Will solar panel prices drop further in late 2026?
Probably not much in the U.S. Global oversupply argues for lower prices, but tariff stacking and FEOC compliance scarcity argue higher. The most likely path is flat-to-slightly-up domestic module pricing through year-end, with meaningful declines only if trade policy loosens.
Why did U.S. installations drop so sharply in Q1 2026?
The 2025 safe-harbor pull-forward moved utility-scale energization earlier, and high financing costs continued suppressing loan-funded residential. Residential actually grew 6% year over year — the headline decline is mostly a utility-scale timing artifact.
What is FEOC and why does it matter for buying equipment?
Foreign Entity of Concern rules restrict tax credit eligibility for projects using components linked to certain foreign entities. The PV threshold rises to 45% in January 2027, which makes compliant inventory progressively scarcer and more valuable through H2 2026.
Is now a good time to buy solar equipment in bulk?
For FEOC-compliant and domestic-content-eligible equipment, yes — scarcity value is rising into 2027. For standard import modules, there's less urgency given the global supply glut, but quote validity windows are short, so time purchases to project awards.
How do the 2026 incentive deadlines affect project planning?
The July 4, 2026 safe harbor date and the January 2027 FEOC increase create hard demand cliffs. Commercial projects should have begun construction documentation already; residential buyers face the residential credit sunset on its own schedule. Plan procurement backward from these dates.