Most solar panels installed on American homes and businesses today will still be producing useful power 30 years from now. That is not marketing copy — it is what the degradation data, the warranty structures, and three decades of field experience all point to. The modern crystalline silicon panel is one of the most durable electrical products ever mass-produced: no moving parts, a tempered glass face, and a semiconductor junction that wears out so slowly that most owners will sell the building before the array quits.

I have pulled panels off barn roofs in Oregon that were installed in the early 2000s, and every single one of them still produced within 20% of its original nameplate rating on my flash tester. That tracks almost exactly with what the National Renewable Energy Laboratory (NREL) found when it analyzed nearly 2,000 systems across the United States: a median degradation rate of about 0.5% per year for modern crystalline silicon modules. This guide walks through what that number actually means for your roof, your wallet, and your 30-year energy plan — with the real tables, the warranty fine print, and the failure modes that actually kill panels early.
The Short Answer: 25 to 30+ Years of Useful Life
A quality solar panel does not have a fixed expiration date. Instead, it has a degradation curve — a slow, predictable decline in output. The industry treats "end of life" as the point where a panel falls below 80% of its original rated output, because that is the threshold most performance warranties use. Here is what the timeline looks like for a typical modern panel:
| Year of Service | Expected Output (0.5%/yr degradation) | Expected Output (0.4%/yr premium N-type) | What Is Typically Happening |
|---|---|---|---|
| Year 1 | 97–98% (after ~2% first-year LID) | 98–99% (after ~1% first-year LID) | Light-induced degradation settles in during the first weeks of sun exposure |
| Year 5 | ~95.5% | ~97% | Panel is past infant-mortality failures; output is stable |
| Year 10 | ~93% | ~95% | Product warranty midpoint; most panels still look and test like new |
| Year 15 | ~90.5% | ~93% | First inverter replacement likely happened around here |
| Year 20 | ~88% | ~91% | Performance warranty checkpoints (many premium panels guarantee ≥87.4% here) |
| Year 25 | ~85.5% | ~89% | Standard performance warranty endpoint (most guarantee 84.8–92% at year 25) |
| Year 30 | ~83% | ~87% | Still above the 80% "end of life" threshold for most panels |
| Year 40 | ~78% | ~83% | Premium panels cross 80% somewhere in this window; budget panels approach it |
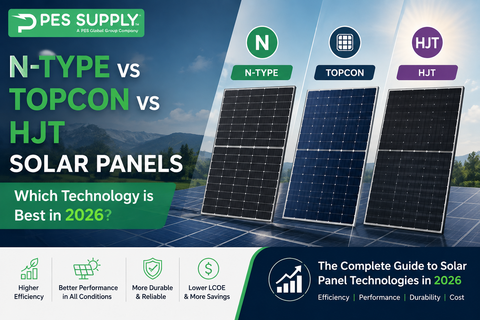
The math above uses the linear degradation model that virtually every manufacturer warranty is written around: first-year light-induced degradation (LID), then a fixed annual decline. A standard PERC monocrystalline panel losing 0.5% per year after a 2% first-year drop sits at about 85.5% of nameplate in year 25 — comfortably above the 80% line. Premium N-type TOPCon and heterojunction (HJT) panels, which now dominate our N-type panel collection, degrade slower (0.35–0.45% per year) and start with less LID, which is why their 25-year guarantees run as high as 89–92%.
How Degradation Actually Works (and Why NREL's 0.5% Number Matters)
Solar cells degrade through several physical mechanisms, and understanding them explains why two panels of the same wattage can age very differently:
- Light-induced degradation (LID): Boron-oxygen defects in P-type silicon activate in the first hours of sun exposure, costing 1–3% of output almost immediately, then stabilizing. N-type cells largely avoid this because they use phosphorus-doped wafers.
- Potential-induced degradation (PID): High system voltages can drive ion migration through the encapsulant, especially in hot, humid climates. Modern PID-resistant encapsulants and inverter grounding have mostly tamed this.
- UV and thermal cycling: The backsheet and EVA encapsulant slowly yellow and embrittle under ultraviolet light and daily heat/cool swings. This is the main long-term driver of that 0.4–0.7% annual decline.
- Microcracks: Mechanical stress from hail, wind loads, snow loads, and sloppy handling during installation creates hairline cracks in cells that grow over time and isolate cell areas.
- Corrosion and delamination: Moisture ingress at the frame edge corrodes busbars and can peel the laminate — the failure mode that finally retires most very old panels.
NREL's landmark degradation study (Jordan & Kurtz) surveyed roughly 2,000 systems and found a median of 0.5% per year for crystalline silicon, with thin-film slightly higher and well-made modern modules frequently testing below 0.4%. Here is how the major technologies compare:
| Panel Technology | Typical First-Year LID | Typical Annual Degradation | Expected Output at Year 25 | Common 25-Year Warranty Guarantee |
|---|---|---|---|---|
| P-type mono PERC (standard) | 2.0% | 0.55% | ~84.6% | 84.8–86% |
| P-type mono PERC (premium) | 1.5% | 0.50% | ~86% | 87.4% |
| N-type TOPCon | 1.0% | 0.40% | ~89% | 87.4–89.4% |
| N-type HJT (heterojunction) | 1.0% | 0.35–0.40% | ~89–90% | 90–92% |
| Thin-film CdTe (utility-scale) | ~1% | 0.40–0.50% | ~87–89% | Varies by project |
| Legacy poly (pre-2018) | 2.0–3.0% | 0.60–0.70% | ~81–84% | 80–83% |
The practical takeaway: if you are buying panels today from our monocrystalline collection or browsing the best solar panels of 2026 roundup, a 30-year useful life is a realistic planning assumption, not a hope. Panels from the polycrystalline era (pre-2018) degrade faster and are the ones most likely to hit 80% before year 25.
Product Warranty vs. Performance Warranty: Read Both Numbers
Every panel ships with two warranties, and buyers routinely confuse them:
| Warranty Type | What It Covers | Standard Term | Premium Term | What Voids It Commonly |
|---|---|---|---|---|
| Product (materials/workmanship) | Defects: delamination, junction box failure, frame failure, broken glass from manufacturing flaws | 12–15 years | 25 years (some 30–40 on residential lines) | Unapproved racking clamps, installs outside the manual's clamping zones, cutting or drilling frames |
| Performance (power output) | Guaranteed minimum output, e.g., "≥87.4% of nameplate at year 25" | 25 years linear | 25–30 years linear at higher floors | Shading damage ignored, physical abuse, unauthorized repair |
When I help customers compare panels, the first thing I check is the year-25 performance floor, not the marketing wattage. A 450W panel guaranteed at 92% in year 25 (414W) will out-produce a 460W panel guaranteed at 84.8% (390W) over the back half of its life — the "smaller" panel is actually the bigger one by year 22. That is exactly why we stock lines like the Silfab Elite N-type TOPCon and carry deep inventory in USA-made panels whose warranty service does not require an international freight claim.
One warranty reality check: a 25-year warranty is only as good as the company behind it. Roughly 200 solar manufacturers have exited the market since 2010. Bankability matters. This is a boring point that saves people five figures.
What Actually Kills Panels Early
Degradation is graceful; failures are not. These are the real-world panel killers, ranked roughly by how often I see them in warranty claims and site inspections:
| Failure Mode | Typical Cause | Frequency in Field | Preventable? |
|---|---|---|---|
| Microcrack-driven hot spots | Stepped-on panels during install, hail >1 inch, snow load beyond rating | Common after 8+ years on cheap installs | Yes — quality racking and handling |
| Junction box / diode failure | Heat buildup under partial shade, water ingress | Moderate; the #1 warranty claim category | Mostly — shade design and quality J-boxes |
| Delamination / backsheet failure | Cheap backsheets, high-UV desert exposure, moisture | Moderate in hot climates | Yes — dual-glass or proven backsheet films |
| PID (potential-induced degradation) | High-voltage strings in humid climates without PID mitigation | Rare on modern equipment | Yes — PID-resistant modules, proper inverter grounding |
| Snail trails / EVA discoloration | Microcracks + moisture reacting with silver paste | Cosmetic mostly; slight output loss | Partially |
| Glass breakage | Hail beyond rating, impact, thermal stress on edge-damaged glass | Rare; catastrophic when it happens | Partially — 3.2mm tempered glass handles most hail |
| Frame corrosion | Coastal salt air, dissimilar-metal contact | Rare inland; moderate on coasts | Yes — anodized frames, isolation hardware |
The pattern worth noticing: most early deaths trace back to installation quality and environment, not the panel itself. A premium panel mounted with out-of-zone clamps on a flexing rail will fail before a mid-tier panel installed by the book. If you are speccing a project, the racking systems guide and the PV wire selection guide matter as much to 30-year output as the module datasheet does.
Climate: Where You Live Changes the Curve
The same panel ages differently in Phoenix than in Portland. Heat is the primary accelerator — cell temperature coefficients and elevated backsheet temperatures both speed up the chemical aging of encapsulants. Here is a field-realistic adjustment table to NREL's baseline:
| Climate Zone | Example Cities | Expected Annual Degradation (quality mono) | Primary Stressor | Mitigation |
|---|---|---|---|---|
| Hot desert (SW) | Phoenix, Las Vegas, El Paso | 0.55–0.70% | Sustained 65–85°C cell temps, UV | Dual-glass modules, 6"+ roof standoff for airflow |
| Hot humid (SE/Gulf) | Houston, Miami, New Orleans | 0.50–0.65% | Humidity-driven PID and corrosion risk | PID-resistant modules, sealed J-boxes, stainless hardware |
| Temperate (Mid-Atlantic/Midwest) | Columbus, Richmond, Kansas City | 0.45–0.55% | Freeze-thaw cycling, hail events | Standard quality modules; check hail rating |
| Cool/marine (PNW, New England) | Portland, Seattle, Boston | 0.35–0.50% | Low stress; moss/soiling is the bigger issue | Occasional cleaning; standard modules excel here |
| High altitude | Denver, Salt Lake, Albuquerque | 0.45–0.60% | Intense UV offset by cold cell temps | UV-stable backsheets; otherwise straightforward |
My own service territory sits in that cool/marine row, and the degradation numbers we measure on 10- and 15-year-old arrays routinely beat the NREL median. Cool panels are happy panels. If you are in a hot climate, spending up for dual-glass or HJT modules is one of the few upgrades that pays for itself purely in slowed aging.
The Uncomfortable Truth: Everything Else Dies First
Panels are the longest-lived component in the system by a wide margin. Planning a 30-year array means planning for the replacement cycle of everything attached to it:
| Component | Typical Lifespan | Warranty Norm | Replacements Over 30 Years (typical) | Notes |
|---|---|---|---|---|
| Solar panels | 30–40+ years | 25-yr performance / 12–25-yr product | 0 | The anchor of the system |
| String inverter | 10–15 years | 10 years (extendable to 20–25) | 1–2 | Budget $0.10–0.20/W per swap including labor |
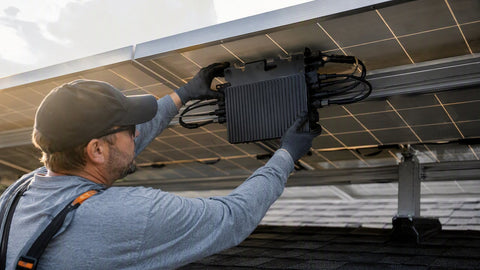
| Microinverters | 20–25 years | 25 years | 0–1 | Higher upfront cost, matches panel life better |
| Power optimizers | 20–25 years | 25 years | 0–1 | Pair with a string inverter that will still need replacement |
| Battery storage (Li-ion/LFP) | 10–15 years (4,000–6,000+ cycles) | 10 years / 70% capacity | 1–2 | See our battery life extension guide |
| Racking & flashing | 30+ years | 20–25 years | 0 (if flashed correctly) | Re-roofing under an array is the expensive surprise |
| Monitoring/communications | 5–10 years | 5 years | 2–3 | Cheap to replace; plan on it |
That inverter line item is why the microinverter vs. string inverter decision is really a lifetime-cost decision. A string inverter from our string inverter collection costs less today; microinverters cost less across 30 years in most cases once you price the year-12 replacement and the truck rolls. Run both scenarios through the solar ROI calculator before committing.
How to Get 30+ Years Out of Your Array
Longevity is mostly bought at installation, then preserved with cheap habits:
- Buy tier-one or better, and check the year-25 floor. The gap between an 84.8% and a 92% guarantee compounds to roughly 10,000 kWh of lifetime difference on a typical 8 kW residential system.
- Install to the manual. Clamping zones, torque specs, rail spans, and wire management are not suggestions. Most voided warranties I have seen trace to clamp placement.
- Roof first, panels second. If your shingles have fewer than 15 years left, re-roof before the array goes on. Removing and reinstalling an array for a re-roof costs $3,000–$6,000 and adds handling risk to every module.
- Keep them clean enough. In most US climates, rain does the job. In dusty or low-rain regions, one or two cleanings a year recovers 1–5% of annual energy. Never pressure-wash; never scrape with metal.
- Monitor output. A 10% unexplained drop is a fault, not aging. Aging is 0.5% a year. Catch diode failures and shading changes early.
- Trim the trees on schedule. Shading that grows in over a decade is the silent output thief I see most on older systems — and chronic partial shade is what overheats bypass diodes.
- Inspect after major storms. A post-hail walk-around (or drone photo set) catches cracked glass while insurance will still pay for it.
End of Life: Reuse and Recycling

Panels that hit 75–80% of nameplate are not scrap — they are discounted inventory for off-grid cabins, agricultural pumps, and battery-charging rigs where peak output does not matter. A healthy secondary market exists, and we routinely see 20-year-old modules find second lives at 50–70W below rating. For panels that are truly done, the glass and aluminum (about 80% of module mass) are conventionally recyclable, and dedicated PV recyclers now recover silicon, silver, and copper. Several states, including Washington and California, have enacted or proposed module end-of-life stewardship rules, so the infrastructure keeps improving.
The Economics of Degradation: What 0.5% a Year Costs in Dollars
Degradation sounds abstract until you price it. Take a typical 8 kW residential system in a 4.5 peak-sun-hour region producing roughly 10,200 kWh in year one. At a blended retail rate of $0.17/kWh, that is about $1,734 of annual value. Here is how degradation compounds against the utility-rate inflation that usually runs the other direction:
| Year | Output @ 0.5%/yr (kWh) | Value @ flat $0.17/kWh | Value @ 3%/yr utility escalation | Cumulative Energy (kWh) |
|---|---|---|---|---|
| 1 | 10,200 | $1,734 | $1,734 | 10,200 |
| 5 | 9,998 | $1,700 | $1,970 | 50,490 |
| 10 | 9,745 | $1,657 | $2,227 | 99,700 |
| 15 | 9,497 | $1,614 | $2,517 | 147,600 |
| 20 | 9,256 | $1,573 | $2,845 | 194,300 |
| 25 | 9,020 | $1,533 | $3,216 | 239,800 |
| 30 | 8,789 | $1,494 | $3,635 | 284,200 |
Two things jump out of that table. First, even at year 30 the system still produces 86% of its original energy — degradation costs you about 14% of lifetime production across three decades, which is already priced into any honest payback model. Second, utility escalation outruns degradation in every market I have modeled: the value of a degraded kWh in year 25 exceeds the value of a fresh kWh in year 1 wherever rates rise faster than 0.5% annually, which is almost everywhere. This is why a 25-year-old array at 86% output is still an asset worth keeping, and why the ROI math keeps improving the longer you hold the system.
2005 Panels vs. 2026 Panels: How Much Better Is "Modern"?
Customers with older arrays often ask whether today's panels are genuinely more durable or just more powerful. The honest answer is both, and the durability gains are specific:
| Attribute | Typical 2005 Panel | Typical 2026 Panel | Durability Impact |
|---|---|---|---|
| Cell type | Polycrystalline or early mono | Mono PERC / N-type TOPCon / HJT | Lower LID, slower annual decline |
| Nameplate wattage (residential size) | 165–200W | 400–470W | Fewer panels, fewer connections, fewer failure points per kW |
| Bypass diodes | 2–3, often undersized | 3, higher thermal margin | Far fewer shade-related diode deaths |
| Backsheet | Single-layer TPT variants, some now chalking badly | Proven co-extruded films or dual glass | Delamination largely engineered out |
| Frame | 35–40mm, lighter anodizing | 30–35mm, better alloys and coatings | Better load ratings, less corrosion |
| Performance warranty | 80% at 25 years | 84.8–92% at 25 years | Manufacturers now guarantee what the physics already delivered |
| Annual degradation (measured fleets) | 0.6–0.8% | 0.35–0.55% | Roughly 5–8 points more output retained at year 25 |
I have tested plenty of 2005-era polycrystalline modules that still pass, so this is not an argument that old panels were junk. It is an argument that a panel bought in 2026 starts with two decades of manufacturing refinement baked in — better cell passivation, better encapsulants, better diode thermal design — and the warranty floors finally reflect that reality.
Residential vs. Commercial vs. Utility Arrays: Different Clocks
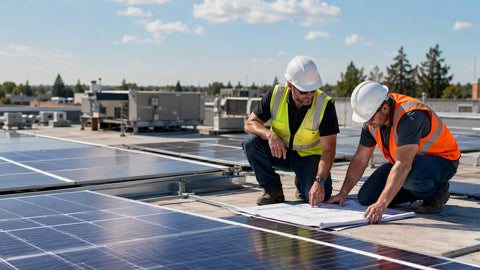
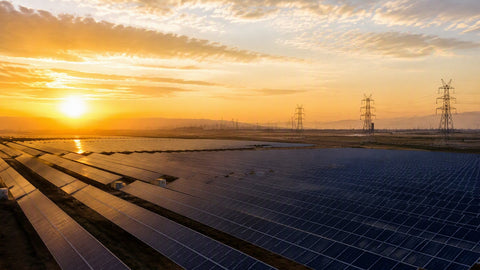
Lifespan expectations shift with the duty cycle. Residential rooftop arrays live the easiest life: moderate mechanical loads, attentive owners, and monitoring that flags problems in days. Commercial flat-roof ballasted systems see more thermal cycling (membrane roofs radiate heat back into module backs) and more foot traffic during HVAC service, but benefit from professional O&M contracts. Utility-scale arrays run the hardest duty — trackers adding mechanical motion, 1,500V strings stressing insulation, and vegetation-management realities — yet their operators treat degradation as a managed financial variable, repowering blocks when the math says so rather than when modules fail.
For the homeowner, the commercial lesson worth stealing is the O&M mindset: an annual production review, an occasional cleaning where soiling justifies it, and a storm-damage inspection habit. Panels last longest when someone is paying a little attention. The systems I see in trouble at year 12 are almost never victims of bad silicon; they are victims of a decade of unexamined shading growth or a failed optimizer nobody noticed.
Reading the Datasheet: The Numbers That Predict Long Life
Five datasheet lines tell you more about longevity than the marketing headline:
- First-year degradation and annual degradation figures. Premium spec sheets now state both explicitly (e.g., "≤1.0% first year, ≤0.40%/yr thereafter"). If a sheet only says "80% at 25 years," the guarantee is dated.
- Temperature coefficient of Pmax. −0.35%/°C is decent; −0.29 to −0.30%/°C (typical of HJT and top TOPCon) means less heat stress per degree and slower aging in hot climates.
- Mechanical load ratings. 5,400 Pa front / 2,400 Pa rear is a solid residential benchmark; snow-country buyers should look higher and check that the rating uses the clamping zones you will actually use.
- Hail certification. The baseline test is 25mm ice at 23 m/s; premium panels certify to 35–45mm. In hail alley, this line matters more than any other.
- PID resistance and damp-heat hours. Look for explicit PID-free claims and 2,000+ hour damp-heat testing (85°C/85% RH). These are the certificates that correlate with low field degradation in humid regions.
Field Notes: What 15 Years of Inspections Taught Me
Three patterns repeat across every fleet I have walked. First, the arrays that die young die from heat and shade, not age — a string that spent years fighting a growing maple tree will show diode damage and hot spots while the unshaded strings beside it test like new. Second, wire management is a lifespan issue: PV wire flapping against a roof abrades insulation over years, and I have traced more than one "dead panel" warranty call to a chafed conductor rather than the module itself. Third, the cheapest panel on the quote is rarely the cheapest panel over 25 years — once you price a single truck roll to replace one failed budget module under a warranty claim that takes six weeks to process, the $40 premium per panel for a bankable brand looks like the bargain it is.
Degradation Is Not the Same as Dirt: Separating Aging from Losses
Owners routinely conflate three very different output declines, and the distinction matters because two of them are fixable:
| Loss Type | Typical Magnitude | Pattern | Reversible? |
|---|---|---|---|
| True degradation (LID + aging) | 0.35–0.6% per year | Slow, smooth, permanent decline across the whole array | No — this is the physics of the module |
| Soiling (dust, pollen, bird droppings, ash) | 1–5% in most US regions; 7%+ in dusty/dry areas or near agriculture | Gradual buildup between rains; recovers after cleaning or storms | Yes — fully, with cleaning |
| Faults (diodes, connectors, shading growth, inverter clipping) | 5–100% of a string | Sudden steps, uneven string performance, error codes | Yes — with repair |
Here is the field test I use: if your monitoring shows a step change — output was fine Tuesday and 15% lower Wednesday — that is never degradation. Degradation does not move in days. Steps mean faults: a tripped optimizer, a failed bypass diode, a new shadow from a neighbor's addition. If the decline is a gentle slope of a few tenths of a percent per year, that is normal aging, and the correct response is to update your long-term spreadsheet, not to call a truck. Soiling sits in between: a gentle decline that resets after a hard rain. Knowing which curve you are looking at saves real money in unnecessary service calls, and it is the difference between an owner who catches a $200 diode fix in month one and one who lets a hot spot cook a panel for three summers.
Panels, Insurance, and Resale: The 30-Year Paperwork Side
A long-lived array intersects with two institutions that think in shorter horizons. Home insurance treats rooftop solar as part of the dwelling in most states, which means hail and wind coverage usually extends to the array — but only if the system is declared. An undeclared $25,000 array is an expensive argument after a storm. On the resale side, owned solar now appraises measurably: studies of US home sales consistently find owned arrays adding roughly $4 per installed watt at sale, and — more relevant to lifespan — buyers and appraisers increasingly ask for production history. A 10-year-old system with clean monitoring records showing textbook degradation is an asset with documentation; the same system with no records is a question mark that gets discounted.
My advice to every customer at commissioning: export your first-year production report, note the installation date and equipment serials, and put both in whatever folder holds your deed paperwork. The panels will almost certainly outlast your ownership of the house — make sure the paper trail outlasts it too.
A 30-Year Ownership Timeline
| Period | Expected Events | Owner Actions |
|---|---|---|
| Years 0–1 | LID settles; system establishes its true baseline output | Record baseline production; verify monitoring works; register warranties |
| Years 1–10 | Quiet decade; 0.4–0.6%/yr decline; monitoring gear may need replacement once | Annual production review; clean if soiling justifies; trim trees on schedule |
| Years 10–15 | String inverter replacement likely; batteries (if any) near end of first life | Budget the inverter swap; re-check roof condition under array edges |
| Years 15–25 | Steady output at 85–93%; possible second inverter cycle | Post-storm inspections; keep production records for resale value |
| Years 25–30+ | Panels at 83–90%; economics of repowering start to make sense on prime roofs | Compare repair vs. repower math; consider second-life resale of old modules |
Follow that timeline and the answer to "how long do solar panels last" stops being a spec-sheet question and becomes a boring, well-documented fact about your own roof: decades, with the paperwork to prove it. Buy well, install to the manual, keep an eye on the monitoring, and the modules themselves will be the least of your worries for the next thirty years.
Frequently Asked Questions
How long do solar panels really last on a house?
Plan on 30 years of useful service from quality crystalline silicon panels, with output still at 80–88% of original at the 30-year mark. The panels will usually outlive the inverter, the batteries, and possibly the roof under them. The 25-year warranty is a guarantee floor, not an expiration date.
Do solar panels degrade 0.5% every year from day one?
Not quite. Most panels lose 1–3% in the first year to light-induced degradation, then settle into the 0.35–0.6% per-year linear decline. That is why year-1 output often reads a touch below spec and year-2-through-25 performance is eerily stable.
Can a solar panel last 40 or 50 years?
Yes — panels from the 1980s are still generating on research sites, and modern dual-glass modules should age better than those did. Output at year 40 will likely be 75–85% of nameplate for premium N-type panels. Whether it still makes economic sense on a prime roof is a separate question from whether it works.
What shortens solar panel life the most?
In order of damage done: poor installation practices (out-of-zone clamping, walking on modules), chronic partial shading that cooks bypass diodes, extreme heat without airflow clearance, and physical impact from hail or debris. The panel chemistry itself is rarely the problem.
Is it worth replacing 20-year-old panels?
Usually not for the panels alone — a 20-year-old array at 88–90% output is still earning. Replacement makes sense when you are re-roofing anyway, when inverter failure coincides with a desire to upsize, or when panel prices and wattage gains (a modern panel makes 2.5× the watts of a 2005 panel in the same footprint) justify a full redesign.
How do I check if my old panels are degrading normally?
Compare a clear-sky production day this year against the same conditions in your monitoring history, adjusting for weather. Annual declines much above 1% warrant inspection: thermal imaging for hot spots, a visual check for delamination and snail trails, and IV-curve testing if you suspect a warranty claim. A flash or IV test against nameplate is the only number a manufacturer will accept for a performance claim.
Related reading: Solar panel kits buyer's guide · Solar system size calculator · Residential solar panels · Solar inverters · Solar installation guide