Every few years the electricity industry produces a number so far outside its own planning models that the policy conversation changes overnight. The PJM capacity auction for the 2025/26 delivery year was one of those numbers: $269.92 per megawatt-day, up from $28.92 the year before — a 833% single-auction jump in the price of guaranteed power supply across the largest grid in America. That price signal was not a market glitch. It was the bill arriving for a decade of flat-load assumptions colliding with data centers, electrification, and retiring power plants. Energy policy reform has moved from a think-tank topic to a kitchen-table economics issue, and this piece explains the demand numbers driving it, the specific policy failures that need fixing, and what it all means for your electric bill and your backup power planning.
Why This Is Urgent — In Four Numbers
- +833% — the one-year jump in PJM's RTO-wide capacity price (2024/25 to 2025/26 auction)
- ~945 TWh — projected global data center electricity demand by 2030, up from ~415 TWh in 2024 (IEA)
- ~2.6 TW — generation and storage capacity stuck in U.S. interconnection queues (LBNL)
- ~$210/yr — what each 2¢/kWh retail rate increase costs the average American household
As detailed in our companion piece on global energy and electricity demand growth, worldwide electricity consumption rose about 4.3% in 2024 and is projected to keep growing near 4% annually through 2027 (IEA). The United States is a full participant again after fifteen flat years, and data centers are the wedge:
| Demand Driver | Current Scale | Trajectory |
|---|---|---|
| Data centers (global) | ~415 TWh/yr (2024) | ~945 TWh by 2030 (IEA) |
| Data centers (U.S. share of national demand) | ~4–5% | 6.7–12% by 2028 (LBNL estimate range) |
| Electric vehicles (per household) | ~3,500 kWh/yr added | EV share of new car sales climbing |
| Building electrification (per household) | ~3,000–5,000 kWh/yr for heat-pump conversion | Accelerating under state and local policy |
| Industrial reshoring | Chip fabs and battery plants at 100–1,000 MW each | Hundreds of announced facilities |
These loads are arriving faster than the grid can absorb them. A single gigawatt-scale data center campus equals roughly 800,000 homes' worth of electricity, announced on a two-year construction timeline, in regions where transmission upgrades take seven to ten years to permit and build. Something in that arithmetic has to give — and right now, what gives is price.
Capacity markets exist to pay power plants for being available in future years. They are the canary in the coal mine for supply-demand balance, and the canary is screaming:
| PJM Base Residual Auction | RTO-Wide Clearing Price | Change |
|---|---|---|
| 2024/25 delivery year | $28.92/MW-day | Baseline |
| 2025/26 delivery year | $269.92/MW-day | +833% in one auction |
| 2026/27 delivery year | $329.17/MW-day | Further +22%; capped near the auction ceiling |
Capacity costs flow through to retail bills with a lag, which means the 2024 and 2025 auction results are still landing on customer statements. The household math is direct: at the U.S. average consumption of roughly 10,500 kWh per year, every 2¢/kWh increase in the retail rate costs a household about $210 annually — $420 at 4¢. In the PJM footprint, regulators have publicly projected bill impacts in exactly that range. This is not abstract policy; it is a line item on the same bill you pay for groceries.
The single most concrete policy failure is the interconnection process — the studies a new generator must complete before connecting to the grid. Lawrence Berkeley National Laboratory's queue analysis paints the picture:
| Resource in Queue (approx.) | Capacity Waiting |
|---|---|
| Solar | ~1,080 GW |
| Battery storage | ~1,030 GW |
| Wind (onshore + offshore) | ~370 GW |
| Total active queue | ~2,600 GW — more than double the entire existing U.S. fleet |
Only a fraction of queued projects historically reach commercial operation, and typical wait times have stretched to four years and beyond. The projects exist. The capital exists. The permission structure does not. FERC's Order 2023 reformed the process — cluster studies, firmer deposits, penalties for speculative projects — but implementation is measured in years while data center load is measured in months.
Strip away the partisan framing and the reform list is remarkably consistent across grid operators, utilities, consumer advocates, and developers:
| Reform Area | The Problem | What Reform Looks Like |
|---|---|---|
| Interconnection | 4+ year queues; speculative projects clog studies | FERC Order 2023 implementation; cluster studies; automated screening |
| Transmission permitting | 7–10 year timelines across state and federal reviews | One-stop federal siting for national-interest lines; cost-sharing clarity |
| Capacity markets | Price signals arrive after shortages, not before | Longer forward commitments; accreditation that counts resources honestly |
| Demand flexibility | Load treated as fixed when it can be a resource | Virtual power plants, smart thermostats, and EVs paid to shift load |
| Large-load interconnection | Data centers socialize grid costs onto all ratepayers | Large customers fund their own network upgrades; bring-your-own-generation options |
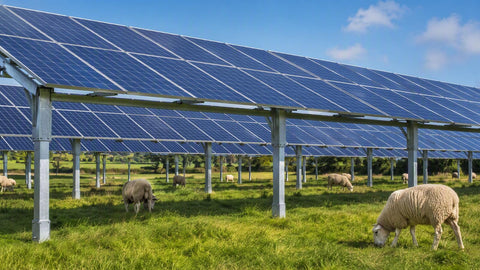
Notice what is not on the list: arguing about which single technology saves us. The grid needs everything — fast-build solar (the largest source of new U.S. capacity, per our solar market outlook), storage to firm it, gas for duration, and demand flexibility to shave peaks. Policy that picks fights between technologies while the queue stalls is solving the wrong problem.
Policy reform debates feel distant until they land on your bill or leave you in the dark. Three practical responses we see working:
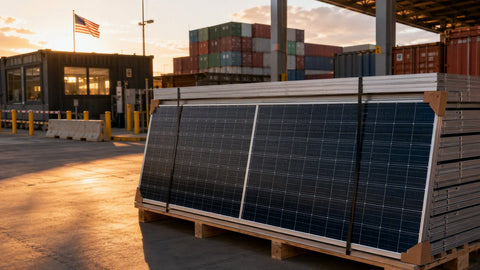
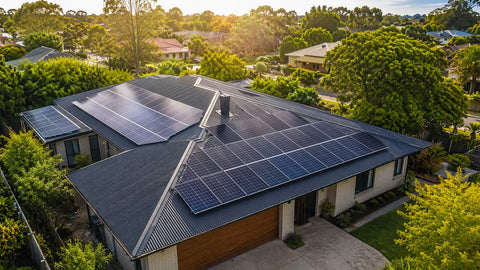
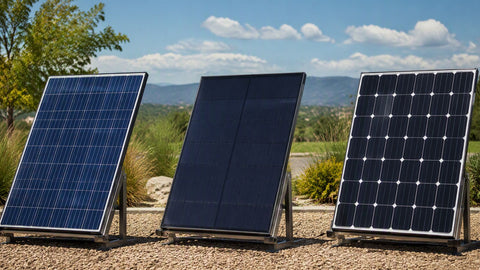
- Assume rates rise, and hedge with self-generation. Rooftop solar at today's equipment prices locks in a large share of your consumption at a fixed cost while retail rates absorb capacity and transmission buildout. The solar panel collection shows current pricing; pair it with storage using the battery sizing guide.
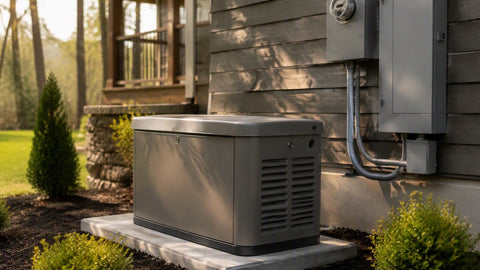
- Treat resilience as infrastructure, not paranoia. Tighter grid margins plus extreme weather means the expected frequency of outages is rising in stressed regions. A correctly sized standby generator — start with the sizing guide, then the standby collection — is a one-time capital expense against a recurring risk. Our generator market update documents how demand for standby power is tracking grid instability.
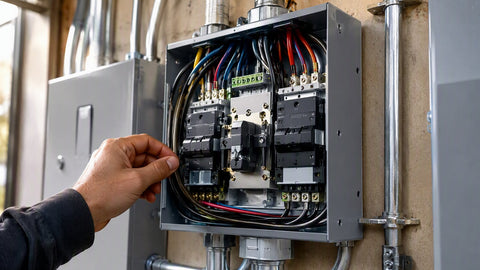
- Electrify with the panel in mind. If your state's policy pushes EVs and heat pumps — and most do, as covered in the electrification boom analysis — the 200A service upgrade stops being optional. Plan it once, before the EV arrives, and have the transfer equipment conversation at the same time.
I've had this conversation hundreds of times at the counter, and it has changed. Five years ago customers asked whether the grid was really getting less reliable; now they walk in citing the PJM auction or their latest rate case and ask what to buy. The answer hasn't changed — generate what you can, store what you can't, and back up the rest — but the urgency behind the question is new, and the demand numbers say it is justified.
Federal market rules get the attention, but state policy decides what households actually experience. Rate design is the clearest example: states with strong net metering export compensation make rooftop solar a bill-killer, while states that have reformed exports toward avoided-cost rates — California's NEM 3.0 being the most consequential — push the value proposition toward storage and self-consumption. Neither is "pro-" or "anti-solar" in the physical sense; both are choices about who pays for grid capacity, and both reshape the equipment a contractor should quote.
Siting and permitting reform is the second state battleground. A growing list of states have consolidated energy-facility siting into single state-level authorities precisely because local-by-local approval cannot produce infrastructure at the speed demand is arriving. And on the demand side, building codes and appliance standards — electrification mandates for new construction, heat-pump incentives, EV-ready wiring requirements — are quietly writing the household load growth of the 2030s into law today.
Of every item on the reform agenda, demand flexibility is the one that can pay households directly instead of billing them. Virtual power plants aggregate thousands of home batteries into dispatchable grid resources; smart-thermostat and water-heater programs shave peaks for bill credits; EV managed-charging tariffs reward overnight charging with rates a third of the peak price. The physics are kind here: an EV sitting in a driveway for 20 hours a day is a flexible load, and a home battery is a power plant the utility doesn't have to permit.
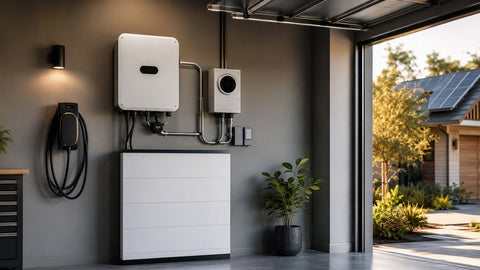
The catch is that participation requires the hardware first. A home with solar and storage is positioned to earn from every flexibility program its utility rolls out over the next decade; a home without them watches from the sidelines. That is the least-appreciated part of the policy conversation — reform is not just about avoiding higher rates, it is about who gets paid when the grid needs help.
Set expectations honestly: interconnection reform is a multi-year implementation, transmission lines permitted today energize late in the decade, and capacity market fixes move prices on a three-year forward lag. The demand side, meanwhile, compounds quarterly. That mismatch means the 2020s' remaining years likely bring continued tight capacity markets, persistent upward rate pressure in high-growth regions, and periodic reliability scares during extreme weather — with policy relief arriving progressively, not in one sweeping fix.
The homeowner's playbook inside that timeline is boring, proven, and genuinely effective. Lock in what you can control: efficient equipment, a right-sized solar array, storage where the rate design rewards it, and standby power where outages carry real cost. I've quoted systems through three policy eras now, and the customers who fared best never tried to time the politics — they built resilience against the grid they actually had, and every reform passed since has only improved their economics.
Every reform on the agenda reshapes the distributed-energy business, mostly for the better. Faster interconnection does not just help utility-scale projects — the same study backlogs delay commercial rooftop interconnections in constrained territories, and queue reform shortens the path from signed contract to permission-to-operate. Capacity market reforms that credit storage and demand response honestly create the revenue streams that make batteries pencil in more states. And large-load interconnection rules that require data centers to bring or fund their own capacity reduce the ratepayer cross-subsidy problem that is currently souring public opinion on the entire buildout.
The watch item for installers is rate design reform, because it cuts both ways. Fixed-charge increases and export-rate reductions can erode rooftop economics in ways no equipment price decline fully offsets — the California experience showed a market can contract sharply on a single regulatory decision even while national demand grows. Diversification is the industry's answer: contractors who sell solar, storage, and standby power together are insulated against any single policy swing, because nearly every plausible reform rewards at least one leg of that stool.
Electricity is the load-bearing input of modern life, and the grid that delivers it was planned for a world of flat demand that no longer exists. The numbers in this article — 4%+ global growth, 833% capacity price spikes, a 2.6 TW interconnection queue — describe a system being asked to grow faster than its institutions currently allow. Reform will come eventually because it must; the only genuinely open questions are how fast, and how much economic pain accumulates in the gap.
For readers of a supplier's blog, the takeaway is not despair but positioning. The same forces straining the grid are the forces making distributed generation, storage, and backup power more valuable every year. Policy will eventually catch up to physics. Until it does, the households and businesses that control their own supply are the ones insulated from the wait.
It is worth closing the loop on where this article began: the PJM auction number. An 833% price spike is not the market failing — it is the market working, sending the loudest possible signal that supply must grow. The policy question is whether the institutions that govern interconnection, transmission, and permitting will let that signal be answered in time. Every year of delay compounds the cost for ratepayers, and every household that builds its own generation, storage, or backup capacity in the meantime is one less customer fully exposed to the answer arriving late. That is not ideology; it is simply the arithmetic that the demand curve has been writing in plain sight for three straight years.
A final observation from the equipment side of the business: the market is already voting. Standby generator sales, home battery attachment rates, and panel-upgrade work have all climbed in lockstep with the demand headlines — not because of marketing, but because customers read the same auction results and rate cases that regulators do. The households acting now are not predicting a collapse; they are pricing a trend. When the largest grid in America reprices firm capacity by 833% in a single auction and the follow-up auction goes higher, treating that as background noise is itself a decision — just an unexamined one. The examined alternative costs less than most people assume, and it starts with a simple load calculation and an honest conversation, not a bunker.
Why is electricity demand growing so fast?
Four drivers converged at once: data centers (projected by the IEA to grow from ~415 TWh globally in 2024 to ~945 TWh by 2030), electric vehicles, building electrification like heat pumps, and industrial reshoring. After roughly fifteen flat years, U.S. demand is growing again at around 2% annually — with much faster growth in data-center-heavy regions.
What happened in the PJM capacity auction?
PJM's auction for the 2025/26 delivery year cleared at $269.92/MW-day, up from $28.92 the prior year — an 833% increase — and the 2026/27 auction cleared higher still at $329.17/MW-day. Capacity costs feed into retail electric bills, so these auction results translate directly into household rate increases across the PJM region.
What is the interconnection queue problem?
About 2.6 TW of proposed generation and storage — more than double the entire existing U.S. fleet — is waiting for grid connection studies, with typical waits exceeding four years. FERC Order 2023 reformed the process, but implementation takes years while new demand, especially data centers, arrives in months.
How much will rising demand raise my electric bill?
At the U.S. average household consumption of roughly 10,500 kWh per year, every 2¢/kWh rate increase costs about $210 annually. Regulators in capacity-constrained regions have projected bill impacts in that range from recent capacity auction results alone, before counting transmission buildout costs.
What can homeowners do about grid instability?
Three practical hedges: rooftop solar to fix a share of your consumption at a known cost, battery storage to shift load and ride through short outages, and a correctly sized standby generator for extended events. Planning a 200A panel upgrade ahead of EV and heat-pump additions avoids emergency electrical work later.
Is energy policy reform actually happening?
Partially. FERC Order 2023 (interconnection reform) is being implemented, several states have passed permitting reforms, and capacity market rules are under active revision in PJM and elsewhere. The pace of reform remains slower than the pace of load growth — which is precisely the urgency this article describes.
Don't Wait for Policy to Catch Up
Solar, storage, and standby power from 169 authorized brands — PES Supply ships nationwide from 12+ hubs.
Get a Free Quote