Updated September 2026 — refreshed against the live PES catalog; product pricing verified 2026-09-26.
2026 product line update
| Product | Class | Price |
|---|---|---|
| Canadian Solar 710W TOPCon Bifacial Solar Panel | 710W | $340.80 |
| Hyundai 640W 156-Cell TOPCon Bifacial Solar Panel | 640W | $220.78 |
| Thornova Solar TS-BGT72(600) 600W Bifacial Solar Panel | 600W | $165.76 |
| Thornova Solar 595W Solar Panel 144 Cell Bifacial TS-BGT72(595) Wholesale 31 panels per pallet | 595W | $164.64 |
| ZNShine Solar 585W 144-Cell Bifacial Solar Panel | 585W | $246.99 |
| Hyundai HiS-S585OJ 585W Clear on Transparent156 Half-Cell Bifacial Solar Panel | 585W | $195.86 |
Live prices verified 2026-09-26. The current pallet line tops out at 550–640W, plus the Canadian Solar 710W TOPCon flagship panel.
The gap between what solar costs and what people get quoted is wide enough to park a truck in. We sell solar equipment at wholesale, so we see both sides: what the hardware actually costs, and what installed systems sell for. This guide gives you the real numbers for 2026 — cost per watt by system size and state, what each line item should run, what a fair quote looks like, and the red flags that tell you to get another bid. No vague ranges sized to hide margins. Actual numbers, with the math shown.

Average Solar Panel System Cost in 2026
The headline figure: residential solar in the U.S. currently installs at $2.50–$3.50 per watt before incentives, with a national midpoint around $2.80–$2.90/W. For the most common residential size — 8 kW — that's $22,400–$25,600 gross, and $15,680–$17,920 after the 30% federal Investment Tax Credit. Cost per watt falls as systems get bigger because fixed costs (design, permitting, mobilization) spread over more watts, which is why quotes for 12 kW systems often price better per watt than 6 kW quotes from the same installer.
One caution about "average" numbers: they blend cash deals, financed deals, and lease-structured pricing, and they blend simple roofs with brutal ones. Your quote should be compared against the size-and-state tables below, not against a single national average.
What You Are Actually Paying For
A solar quote is not a panel purchase — it's a construction project. Here's where the money goes on a typical 8 kW job, and what each line should roughly cost:
| Cost Component | Typical Share of Total Cost | What It Covers | Rough Cost (8 kW system) |
|---|---|---|---|
| Solar Panels | 25 to 30% | The photovoltaic modules themselves | $6,000 to $7,500 |
| Inverter | 10 to 15% | Converts DC solar power to usable AC electricity | $2,500 to $3,500 |
| Racking and Mounting | 8 to 12% | Rails, clamps, and roof attachments that hold panels in place | $1,800 to $2,800 |
| Electrical and Wiring | 8 to 12% | Conduit, wiring, disconnect switches, breakers, and panel upgrades if needed | $1,800 to $2,800 |
| Installation Labor | 15 to 20% | Crew time for rooftop work, wiring, and commissioning | $3,500 to $5,000 |
| Permits and Inspections | 3 to 6% | Building permits, electrical permits, utility interconnection fees | $700 to $1,500 |
| Installer Overhead and Margin | 15 to 25% | Sales, design, project management, warranty support, company profit | $3,500 to $6,000 |
Notice what this table tells you: the panels themselves are barely a quarter of the price. When someone claims panel prices crashed so your quote should too, they're ignoring the other 75%. And that bottom row — overhead and margin — is where overpriced quotes hide. It's also the only line with real negotiating room.
Cost by System Size: 4 kW to 15 kW
Panel counts assume modern 400W-class modules; gross costs assume the national $2.80–$3.20/W band. Check the arithmetic: an 8 kW system at $2.80/W is 8,000 × 2.80 = $22,400, and 70% of that after the ITC is $15,680. Every row works the same way:
| System Size | Panels Needed (400W) | Gross Cost | After 30% ITC | Typical Home Size |
|---|---|---|---|---|
| 4 kW | 10 panels | $11,200 to $12,800 | $7,840 to $8,960 | Small home, 1,000 to 1,500 sq ft |
| 6 kW | 15 panels | $16,800 to $19,200 | $11,760 to $13,440 | Average home, 1,500 to 2,000 sq ft |
| 8 kW | 20 panels | $22,400 to $25,600 | $15,680 to $17,920 | Larger home, 2,000 to 2,800 sq ft |
| 10 kW | 25 panels | $28,000 to $32,000 | $19,600 to $22,400 | Large home, 2,800 to 3,500 sq ft, or EV charging |
| 12 kW | 30 panels | $33,600 to $38,400 | $23,520 to $26,880 | Very large home or small business |
| 15 kW | 38 panels | $42,000 to $48,000 | $29,400 to $33,600 | Large estate, multiple EVs, pool, home office |
If your usage doesn't map neatly to these sizes, our guides on 6 kW system costs, 12 kW system costs, and 10 kW installation costs go deeper per size — and how to calculate how much solar you need starts from your bill instead of your roof.
Cost by State: Why Prices Vary So Much
Labor rates, permitting regimes, and installer competition move the price of the identical 8 kW system by more than $7,000 across state lines:
| State | Avg Cost per Watt | 8 kW Gross Cost | 8 kW After ITC | Why It Is High or Low |
|---|---|---|---|---|
| Arizona | $2.60/W | $20,800 | $14,560 | High installer competition, simple flat roofs, mature market |
| Texas | $2.70/W | $21,600 | $15,120 | Low labor costs, growing competition, minimal permit complexity |
| Florida | $2.75/W | $22,000 | $15,400 | Large installer base, hurricane-rated racking adds some cost |
| Colorado | $3.00/W | $24,000 | $16,800 | Moderate competition, snow load racking requirements |
| California | $3.10/W | $24,800 | $17,360 | High labor costs, strict permitting, Title 24 compliance requirements |
| New York | $3.20/W | $25,600 | $17,920 | High labor and permit costs, older housing stock is complex to work on |
| Massachusetts | $3.30/W | $26,400 | $18,480 | Highest labor costs in the country, old homes require extra work |
| Hawaii | $3.50/W | $28,000 | $19,600 | High shipping costs, limited competition, premium labor market |
The pattern is labor and bureaucracy, not sunshine. Arizona's cheap installs have nothing to do with its great solar resource and everything to do with competition and simple roofs. State incentives can flip the net-cost ranking entirely — check the current stack in our incentives by state guide before assuming the expensive states lose.
Panel Brand Cost Comparison
Panel tier is the equipment choice with the biggest cost impact. Here's how the market segments in 2026:
| Panel Tier | Example Brands | Efficiency Range | Panel Cost (per watt) | Best For |
|---|---|---|---|---|
| Budget | Generic / off-brand | 17 to 19% | $0.25 to $0.35 | Large roofs where space is not a constraint |
| Standard Tier 1 | LONGi, JA Solar, Trina, Canadian Solar | 19 to 21% | $0.35 to $0.50 | Most residential and commercial systems |
| Premium Tier 1 | REC, Hanwha Q CELLS, Jinko N-type | 21 to 22% | $0.50 to $0.65 | Space-constrained roofs, high-performance systems |
| Ultra Premium | SunPower Maxeon, Panasonic EverVolt | 22 to 24% | $0.70 to $0.90 | Very small roofs, maximum output priority, premium aesthetics |
Our standard advice: Standard Tier 1 is the sweet spot for most buyers. On an 8 kW system, upgrading from Standard to Premium Tier 1 adds roughly $1,200–$2,400 to equipment cost for maybe 3–5% more lifetime production — worth it on a tight roof, hard to justify on a big one. Stepping down to budget panels saves a few hundred dollars and costs you warranty credibility. Compare current models on the panel comparison page or browse the full panel catalog — JA Solar, Trina, Qcells, and REC cover the standard-through-premium range.
What You Actually Pay After Incentives

The ITC is a dollar-for-dollar tax credit, not a deduction: 30% of gross installed cost comes straight off your federal tax liability. On a $24,000 system that's $7,200. If your tax liability in year one is smaller than the credit, the remainder carries forward. State and utility rebates stack on top in many markets — some states add thousands more, and income-qualified programs can be dramatically richer. The financing interaction matters too: some lenders quote the net-of-ITC price as your loan amount, which only works if you actually apply the credit refund to principal. Read that loan paperwork twice.
How to Spot an Overpriced Quote
After watching thousands of quotes cross our counter, the red flags are consistent:
| Red Flag | What It Often Means | What to Do |
|---|---|---|
| Price above $3.50 per watt | High installer margin, inflated overhead, or a complex site being used to justify a higher price | Get two more quotes from local installers. National brands often cost 20 to 30% more than locals. |
| No itemized breakdown | Hiding markup on hardware or labor behind a single lump sum price | Always ask for a line-item quote showing panel model, inverter model, wattage, and labor cost separately. |
| Pressure to sign same day | High-pressure sales tactics designed to prevent you from comparing prices | Any reputable installer will hold a quote for 30 days. Walk away from same-day pressure. |
| No mention of panel brand or model | Room to swap specified panels for cheaper ones after signing | Require the specific panel model number and wattage to be written into the contract. |
| Oversized system for your bill | Upselling more capacity than you will actually use to increase total sale value | Check: system output (kWh per year) should be close to your actual annual usage, not 30 to 50% above it. |
The sizing check in that last row deserves emphasis, because oversizing is the most common expensive mistake I see. A 12 kW quote for a home using 8,000 kWh a year means paying for 4 kW of panels whose production credits out at wholesale rates — thousands of dollars for near-zero return. Size to your usage, and if a quote exceeds it by more than 10%, ask why.
What a Good Solar Quote Should Include
A quote you can trust shows its work: specific panel model and wattage, inverter make and model, total system size in kW DC, expected annual production in kWh with the assumptions stated, itemized pricing, warranty terms for equipment AND workmanship separately, production guarantee language if any, the assumed utility rate and escalation used in savings projections, and a valid-through date. If any of these are missing, you're not looking at a quote — you're looking at a marketing piece with a dollar figure on it.
Cash, Loan, or Lease: Which Actually Costs Less?
| Option | Upfront Cost | Do You Get the ITC? | Total Cost Over 25 Years | Best For |
|---|---|---|---|---|
| Cash Purchase | Full system cost | Yes, full 30% | Lowest total cost. No interest paid. | Homeowners with savings available who want maximum lifetime savings |
| Solar Loan | $0 down in most cases | Yes, full 30% (use refund to pay down loan principal) | Moderate. Interest paid over loan term reduces net savings by $3,000 to $7,000 depending on rate. | Homeowners who want ownership but prefer not to pay upfront |
| Lease or PPA | $0 down | No. The solar company keeps the ITC. | Highest total cost over time. You pay for the electricity produced but never own the asset. | Renters or homeowners who cannot qualify for a loan and want some bill reduction without any upfront commitment |
One trap hides in loan pricing: dealer fees. A "$0 down, 3.99%" solar loan often carries a 20–30% dealer fee baked into the financed amount, which is how a $24,000 cash system becomes a $31,000 financed one. Always ask for the cash price and the financed price side by side. The gap is the true cost of the loan, and it frequently exceeds the interest itself.
Price Trends: How 2026 Compares to Recent Years
If you're wondering whether prices are high or low right now, here's the trajectory we've quoted through:
| Year | Avg. Residential Cost per Watt (Installed, Gross) | What Moved Prices |
|---|---|---|
| 2022 | $3.30–$3.60/W | Supply chain crisis, UFLPA detentions, equipment scarcity |
| 2023 | $3.10–$3.40/W | Module prices collapse, but labor and financing costs climb |
| 2024 | $2.90–$3.30/W | Equipment cheap, installer competition rising, interest rates bite |
| 2025 | $2.70–$3.30/W | Installer consolidation; financing costs dominate deal economics |
| 2026 | $2.50–$3.50/W | Module prices stabilize; labor and permitting keep floors under system prices |
The takeaway surprises people: equipment got dramatically cheaper while installed prices only drifted down. Labor, permitting, interconnection, and financing absorbed the module savings. That's why chasing a cheaper panel tier saves you hundreds while negotiating the quote's structure saves you thousands.
Adding Batteries: What Storage Does to the Budget
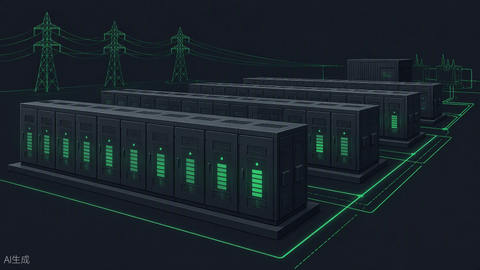
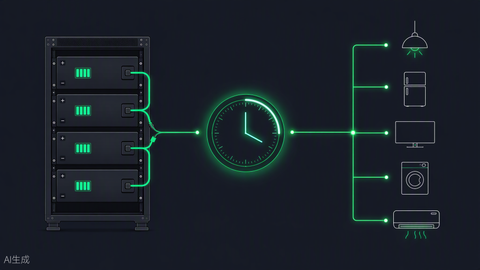
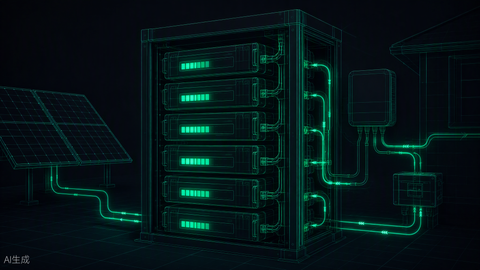
Solar-plus-storage is now the majority of serious residential quotes. Budget honestly: a 13.5 kWh battery adds $10,000–$14,000 installed before incentives (the ITC covers storage at 30% too), and whole-home backup with two batteries and a hybrid inverter can add $20,000–$28,000. The economics depend entirely on your utility: under full retail net metering, batteries are a resilience purchase, not a savings purchase; under time-of-use or export-rate regimes, they earn their keep daily. Size storage to your critical loads, not your whole panel — the battery sizing calculator and our battery buyer's guide walk the math, and the EG4 vs. Powerwall comparison shows how wide the price spread runs between value and premium storage.
How to Compare Three Quotes Like a Pro

Normalize every quote to four numbers before comparing anything else: cost per watt DC (total price ÷ system watts), projected first-year production per installed kW (kWh ÷ kW — anything claiming over 1,600 in a northern climate deserves skepticism), total 25-year cost including loan interest and dealer fees, and the net cost after incentives you'll actually finance or pay. Then check the equipment: panel model, inverter model, and whether racking and monitoring are included. I've watched homeowners save $4,000 in twenty minutes doing exactly this, because the "cheapest" quote was sized 30% larger than their usage and the "expensive" one wasn't.
Production Assumptions: The Number That Inflates Savings
The most dangerous number on a solar quote isn't the price — it's the production estimate, because savings projections are built on it. Defensible production modeling uses your actual roof azimuth and pitch, a local weather file (TMY data), a shade analysis from imagery or a site visit, and honest derate factors: ~14–18% total losses for inverter efficiency, soiling, temperature, wiring, and degradation in year one. Quick math check for any quote: annual kWh ÷ system kW should land between roughly 1,100 (cloudy northern climates) and 1,600 (desert Southwest, ideal tilt). Above 1,650, ask what assumptions produce it. I've reviewed quotes claiming 1,800 kWh/kW for houses in Ohio — that's not an estimate, it's a fantasy with a signature line.
The Quote Comparison Worksheet
Print this table and fill it in when your three quotes arrive. The discipline of writing the numbers side by side resolves most decisions on its own:
| Comparison Line | Quote A | Quote B | Quote C |
|---|---|---|---|
| System size (kW DC) / cost per watt | — | — | — |
| Panel model & inverter model | — | — | — |
| Year-1 production (kWh) / kWh per kW | — | — | — |
| Production as % of your annual usage | — | — | — |
| Net cost after ITC + state incentives | — | — | — |
| True financed cost (cash price vs. loan amount) | — | — | — |
| Workmanship warranty (years) | — | — | — |
Two rows decide more deals than any others: production as a percentage of usage (near 100% is right; 130% is upselling) and the cash-versus-financed gap (which exposes dealer fees). If a salesperson can't fill in a row, that row is your answer.
New Construction vs. Retrofit: Two Different Cost Stories
If you're building new, solar is dramatically cheaper than any retrofit figure above. Panels installed during construction skip the separate mobilization, tie into an electrical service designed for them, and often mount before roofing is complete — total incremental cost commonly runs $2.00–$2.50/W, sometimes rolled into the mortgage at rates solar loans can't touch. Several states and cities now mandate solar-ready roofs or solar outright on new homes. Retrofit buyers should steal one trick from new construction: if you're reroofing anyway, schedule the solar immediately after — the roofer and the solar crew working in sequence saves real money and gives you a fresh roof under a 30-year array.
When to Walk Away From Solar Entirely
Honest guides say no sometimes. Skip solar — for now — if your roof needs replacement within five years and you can't bundle the projects; if shading cuts your usable production below about 70% of an unshaded system's; if your annual bill is under $900 (the fixed costs eat the savings); if you're moving within three years; or if your only financing offer carries a dealer fee above 25% of cash price. Every one of those situations has a fix — reroof first, trim trees, electrify more loads to raise usage, wait, or shop the loan — but buying through them is how people end up as cautionary tales. The right system at the right price on the right roof is a genuinely good investment. Forcing the wrong one is how solar earns its bad reviews.
Leased vs. Owned at Resale: The Price Nobody Quotes You
One cost never appears on any quote: the resale transaction. Owned systems generally add value — buyers pay for lower bills, and appraisers increasingly credit them. Leased systems and PPAs must be transferred to the buyer, bought out at a formula, or paid off at closing, and each path adds friction that shows up as price concessions or delayed closings. If there's any chance you'll sell within a decade, weight ownership options accordingly. A $3,000 financing premium for ownership can return twice that at the closing table compared to transferring a lease to a skeptical buyer's lender.
One final habit separates buyers who get fair prices from buyers who don't: they decide before the appointment. Know your annual kWh, know the fair price-per-watt band for your state from the tables above, and know whether you want cash, loan, or lease terms before the salesperson arrives. Quotes improve measurably when the person across the table has clearly done the homework — every experienced rep can tell within five minutes, and prices follow accordingly.
And a last word on timing: the buyers who fare worst are the ones who sign under deadline pressure — expiring "promotions," crew availability claims, rate-increase warnings. Real price movements in this industry happen over quarters, not weekends. Any quote worth signing today is worth signing after 48 hours and two phone calls to competitors.
Frequently Asked Questions
What is a fair price per watt for solar panels in 2026?
$2.50–$3.50 per watt installed before incentives, depending on state and site complexity. Below $2.50, verify the equipment and installer credentials carefully. Above $3.50, get competing quotes — that's premium territory and it should come with a justification.
How much does an average home solar system cost in total?
The most common residential size, 8 kW, runs $22,400–$25,600 gross and $15,680–$17,920 after the 30% federal tax credit, before any state incentives.
Does a more expensive panel always mean better performance?
No. Premium panels buy efficiency (more watts per square foot) and sometimes better degradation rates. On a large roof, Standard Tier 1 panels produce the same kilowatt-hours per dollar better than premium ones. Pay for premium when roof space constrains you.
How do I know if a solar quote is too high?
Divide total price by system watts. Compare against the state table above. Demand line items. Then get two more quotes — three bids is the single most effective price discipline available to a solar buyer.
Is it worth paying more for a premium installer?
Sometimes. Workmanship warranty strength, service responsiveness, and local permitting fluency have real value — a botched flashing job costs more than any panel upgrade. Pay for track record and reviews, not for brand-name marketing.
Ready to price your system honestly?
Run your usage through the system calculator, check your state's incentive stack, and compare equipment pricing in the panel catalog. If you want wholesale equipment pricing or a second set of eyes on a quote, contact our team — we supply installers and homeowners directly.
Need pricing or availability on anything in this guide?
Portlandia Electric Supply dropships direct from the manufacturer — most items Ship Direct with lead times stated up front, no surprises.
Get a quote from PESBulk, pallet and contractor pricing available.