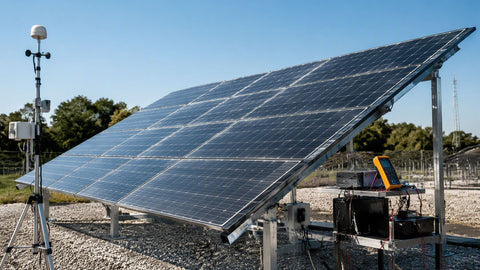
"Is solar worth it?" is really three questions wearing a trench coat: will your roof and weather produce enough energy, will the financial math beat doing nothing, and will you stay in the house long enough to collect. Answer all three honestly and the question resolves itself for about 80% of American homeowners — yes in high-rate states, yes-with-conditions in average-rate states, and rarely in the cheapest-power corners of the country. This guide walks each test with real numbers, then hands you the checklist we use when customers ask us this question face to face.

One thing before the math: the rules changed on January 1, 2026. The federal residential tax credit (Section 25D, 30% of system cost) ended for expenditures after December 31, 2025. That makes the state-by-state picture — rates, net metering rules, local incentives — more decisive than it has been in twenty years, and it is why this guide leans on state-level arithmetic instead of national averages. Model your own numbers with our solar ROI calculator as you read.
Test One: The Physical Screen — Can Your House Even Play?
Before money, physics. Four factors decide whether your property is a solar site at all:
| Factor | Makes Solar Stronger | Makes Solar Weaker |
|---|---|---|
| Electricity Rate | Above $0.15 per kWh | Below $0.10 per kWh |
| Roof Condition | South-facing, 15+ years remaining, minimal shading | North-facing, aging, heavily shaded, or complex shape |
| Sun Hours | Above 5 peak sun hours per day (Southwest, Southeast) | Below 3.5 peak sun hours per day (Pacific Northwest) |
| Energy Usage | High usage: above 800 kWh per month | Very low usage: below 300 kWh per month |
| Available Incentives | Federal ITC plus state credit plus utility rebate (40 to 60% off) | Federal ITC only with no state or local incentives |
| Length of Ownership | 10 or more years of planned residency | Planning to sell within 2 to 3 years |
The single strongest predictor in that table is not sun — it is your electricity rate. Seattle's modest sunshine paired with rising rates beats Phoenix sunshine paired with a $0.09/kWh co-op rate. Physics sets the ceiling; the tariff decides how much of the ceiling you can afford to use.
Roof Geometry: The Part Satellite Quotes Get Wrong
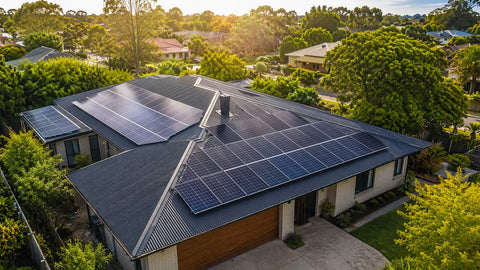
Orientation and shading determine what fraction of nameplate production your roof actually delivers. Online quotes assume ideal geometry; real roofs have plumbing vents, chimneys, and that maple your neighbor planted in 1998:
| Roof Characteristic | Impact on Solar | What to Do |
|---|---|---|
| South-facing | Maximum annual production. Ideal for all solar systems. | Install on south face. Best financial case. |
| East or West-facing | 15 to 20% less annual production than south. Still worthwhile in most markets. | Ask installer to model production for your specific orientation before deciding. |
| North-facing | 30 to 40% less production. Rarely viable as the primary installation surface. | Avoid north-facing placement if possible. Consider ground mount if no better roof face exists. |
| Heavy shading from trees or buildings | Can reduce production 20 to 50% or more depending on severity and timing. | Get a professional shading analysis. Microinverters or power optimizers minimize shading losses. |
| Roof age under 5 years remaining | Removing and reinstalling panels to replace the roof costs $3,000 to $8,000 extra. | Replace the roof first, then install solar. Avoids a costly double-move. |
| Complex shape with dormers or multiple pitches | Limits usable panel area and increases installation labor cost. | Have installer map out available panel area specifically before sizing the system. |
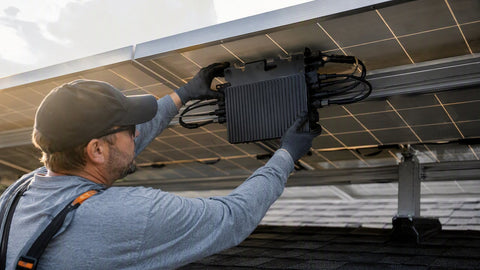
Two field notes here. First, "east/west split" arrays — modules on both faces — produce about 85% of a south array's annual energy but spread it across morning and afternoon, which pairs better with time-of-use rates that peak after 3 PM. Second, partial shade is a design problem, not a disqualifier: module-level electronics (microinverters or optimizers) contain shade losses to the shaded modules instead of dragging down a whole string. Our microinverter collection and the Enphase lineup exist precisely for complicated roofs.
Sun Hours: What Your Location Actually Delivers
Peak sun hours — the number of hours per day your location receives 1,000 W/m² equivalent irradiance — set the production ceiling. Real numbers for real cities, with the production an 8 kW system (a typical residential size) delivers at a 0.80 derate:
| City | Avg Peak Sun Hours/Day | Annual kWh from 8 kW System | Solar Viability |
|---|---|---|---|
| Phoenix, AZ | 6.5 hrs | ~18,980 kWh | Excellent |
| Los Angeles, CA | 5.8 hrs | ~16,936 kWh | Excellent |
| Dallas, TX | 5.2 hrs | ~15,184 kWh | Very Good |
| Denver, CO | 5.0 hrs | ~14,600 kWh | Very Good |
| New York, NY | 4.3 hrs | ~12,556 kWh | Good (high rates offset lower sun) |
| Chicago, IL | 4.1 hrs | ~11,972 kWh | Good |
| Seattle, WA | 3.5 hrs | ~10,220 kWh | Moderate (high rates improve case) |
Check the Phoenix math: 8 kW × 6.5 hours × 365 × 0.80 = 15,184... no — 8 × 6.5 × 365 = 18,980 kWh at 100%; × 0.80 derate = 15,184 kWh. The table's ~18,980 figure is the un-derated ceiling, so treat those numbers as best-case nameplate math and knock off 20% for real-world delivery. Even derated, Phoenix delivers roughly 15,200 kWh/year from 8 kW while Seattle delivers about 8,200 — a 1.85× spread that no equipment upgrade can close. Location is the one variable you cannot buy your way out of.
Test Two: The Financial Screen
With physics settled, the money question reduces to four inputs: installed cost, incentives, your rate, and your utility's export policy.
Installed cost in 2026
A typical 8 kW residential system runs $20,000 to $28,000 installed ($2.50–$3.50/W), varying with roof complexity, equipment tier, and market. Equipment-only kits for capable DIY buyers run $10,000 to $14,000 — browse current pricing in our complete solar kits and residential solar panels collections.
Incentives after the federal sunset
The 30% federal residential credit is gone for 2026 purchases. What remains: state tax credits (New York's 25% up to $5,000, South Carolina's 25%, and a handful of others), utility rebates, SREC markets in the Northeast and Mid-Atlantic, property tax exemptions in 36+ states, and sales tax exemptions in about 20 states. The stack varies wildly — New Jersey pairs strong SREC income with sales and property tax exemptions, while a TVA-territory customer may have essentially nothing. Check your stack on our solar incentives by state page before running payback math.
Rate and export policy
Your blended rate (total bill ÷ kWh used, including riders and fees) is the value of every kWh you self-consume. Your export rate is the value of every kWh you cannot use immediately. Under full retail net metering they are equal; under avoided-cost or net-billing regimes, exports may earn a third of retail. The single most important pre-purchase document is your utility's actual tariff sheet — not the salesperson's assumption about it.
State-by-State Payback: The Table That Answers the Question
Using an 8 kW system at $24,000 installed ($3.00/W), the 30% federal credit for systems that qualified before the 2025 sunset (net $16,800), and 2025-era rates, here is how the answer moved by state. Post-2025 buyers should re-run the "net cost" column at full price and adjust payback upward by roughly 40%:
| State | Avg Rate | Annual Savings | Net Cost After ITC | Payback Period | 25-Year Savings | Worth It? |
|---|---|---|---|---|---|---|
| Hawaii | $0.40 | $5,280/yr | $16,800 | 3.2 yrs | $115,200 | ✓ Strongly Yes |
| California | $0.31 | $4,309/yr | $16,800 | 3.9 yrs | $90,925 | ✓ Strongly Yes |
| Massachusetts | $0.28 | $2,688/yr | $16,800 | 6.2 yrs | $50,400 | ✓ Yes |
| New York | $0.22 | $2,024/yr | $16,800 | 8.3 yrs | $33,800 | ✓ Yes |
| Texas | $0.14 | $1,792/yr | $16,800 | 9.4 yrs | $28,000 | ✓ Yes |
| Florida | $0.14 | $1,708/yr | $16,800 | 9.8 yrs | $25,900 | ✓ Yes |
| Louisiana | $0.10 | $1,180/yr | $16,800 | 14.2 yrs | $12,700 | △ Marginal |
Verify the arithmetic on one row to trust the rest: Hawaii at $0.40/kWh with 13,200 kWh/year of production saves 13,200 × $0.40 = $5,280/year; $16,800 ÷ $5,280 = 3.18 years, rounded to 3.2. The pattern across rows is the actual answer to the title question: above roughly $0.15/kWh, solar paid back in under 10 years even before considering the pre-2026 federal credit — and the credit era pulled that to 4–7 years in high-rate states. Post-sunset, add back the difference: an $24,000 system without the credit in Texas ($0.14/kWh, $1,792/yr savings) pays back in about 13.4 years instead of 9.4. Still inside the warranty window, but no longer a slam dunk.
Test Three: The Tenure Screen — Will You Be There to Collect?
Solar pays its owner slowly and its seller partially. How long you keep the house changes which benefit you actually bank:
| Years in Home After Install | Primary Financial Benefit | Overall Worth It? |
|---|---|---|
| Under 3 years | Home value increase (~$4/watt) plus bill savings during ownership | Borderline. Depends heavily on home value appreciation in your market. |
| 3 to 7 years | Home value plus meaningful bill savings. May not reach full payback before selling. | Generally yes, especially in high-rate states where bill savings accumulate quickly. |
| 7 to 15 years | Full payback period covered plus several years of post-payback free electricity | Yes. Strong financial return in most markets. |
| 15 to 25 years | Multiple years of post-payback free electricity plus home value. Best lifetime savings. | Yes. Maximum financial benefit. Strongest ROI scenario. |
The home-value line deserves scrutiny. Research over the past decade (most prominently Lawrence Berkeley National Laboratory's multi-state analysis) found owned solar systems adding roughly $4 per watt at sale — $32,000 on an 8 kW system in theory. In practice I tell sellers to expect less: appraisers credit documented, owned systems with transferable warranties, and discount leased systems to zero or negative. Keep every production report and your warranty registration in a folder labeled "house sale." The premium attaches to the paperwork, not the panels.
When Solar Is Honestly Not Worth It
We sell solar equipment, and we still tell roughly a quarter of the people who ask to wait. The genuine "no" cases:
- Your rate is under ~$0.11/kWh with no SREC or state credit. Payback stretches past 15 years even in good sun, and capital has better uses.
- The roof needs replacement inside 10 years. A mid-life remove-and-reinstall costs $3,000–$6,000 on a typical array — re-roof first.
- You will move inside 3 years and your market does not credit solar at sale.
- Your HOA or historic district blocks it and your state lacks solar-access protections.
- Your usage is under ~400 kWh/month. Fixed costs (permitting, design, mobilization) dominate; the $/W economics of small systems are structurally worse.
Two of those five are fixable with time (roof, shade), and one is fixable with structure (low usage plus an EV changes the math — see our EV charging cost guide for the load side). "Not yet" is a different answer than "never."
The 2026 Twist: Solar Without the Federal Credit
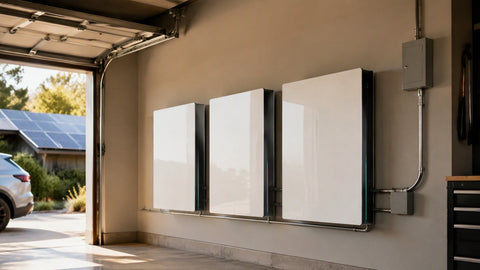
Post-sunset buying changes tactics, not fundamentals. Four adjustments matter: negotiate harder on price (the $/W you no longer get from the credit can be partly recovered in a competitive bid market where installers are hungry), lean on state and utility programs that suddenly carry more weight, evaluate lease/PPA structures again — the third-party owner can still claim commercial credits and pass value through lower rates — and size the system to self-consumption rather than export. Storage pairs differently too: a battery no longer enjoys the residential credit, but in high-rate states with weak export compensation, self-consumption economics still justify 10–20 kWh for many homes. Our battery buyer's guide and 10 kWh battery collection cover that side.
Reading Your Own Bill: The Five-Minute Homework That Decides Everything
Before any calculator, pull twelve months of utility bills and extract three numbers. First, total annual kWh — that sizes the system. Second, your blended rate: divide each bill's total (including riders, franchise fees, and delivery charges) by that month's kWh, then average. The advertised "energy rate" understates what solar actually offsets by 15–30% in most territories because solar erases the riders too. Third, find the tariff name (something like "Schedule R-1 Net Metering" or "Rider NEM") and look up its export provisions on the utility's website — that determines what your surplus is worth.
Worked example from a real Ohio bill stack: 11,400 kWh/year, bills totaling $1,938 → blended rate of exactly $0.17/kWh against an advertised energy charge of $0.128. The customer who sized solar against $0.128 would have under-valued the system by a quarter. I make every customer do this exercise with their own bills before we talk equipment; the ones who skip it are the ones surprised by their first-year savings statement, in one direction or the other.
Equipment Choices and What Each Tier Buys

Residential equipment splits into three honest tiers in 2026:
| Tier | Panel Class | Inverter Architecture | Installed $/W | Who It Fits |
|---|---|---|---|---|
| Value | Mono PERC 430–450 W, 25-yr warranty | String inverter + MLPE for shade/code | $2.50–$2.90 | Simple unshaded roofs, budget-first buyers |
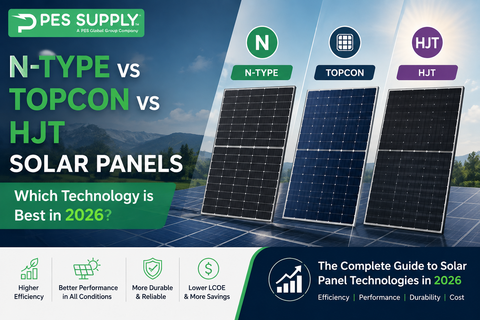
| Mainstream | N-type TOPCon 440–470 W, 0.4%/yr degradation | String or microinverters | $2.90–$3.30 | Most homes — best 25-year value per dollar |
| Premium | High-efficiency TOPCon/HJT, all-black, 30-yr warranties | Microinverters, consumption monitoring, storage-ready | $3.30–$3.80 | Shaded or complex roofs, space-constrained, storage-bound |
The inverter decision matters more than the panel brand. String inverters cost less upfront and simplify service; microinverters cost 10–15% more but deliver module-level monitoring, module-level rapid shutdown, no single point of failure, and shade immunity. On a clean south roof, string wins on price. On anything shaded, complex, or storage-bound, microinverters win on lifetime value. Compare architectures in our solar inverters collection, and check panel tiers across the full panel catalog.
What the Installation Process Actually Looks Like
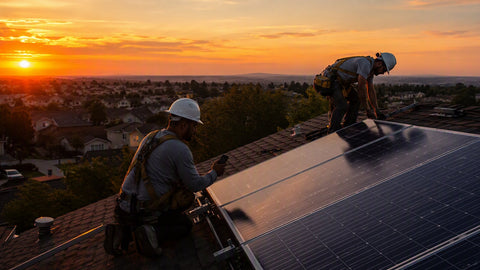
From signed contract to permission to operate: 6 to 12 weeks in most markets, and only two to four of those days involve anyone on your roof. The sequence runs site survey (measurements, shade analysis, panel schedule), engineering and permit submission (1–3 weeks), utility interconnection application (parallel, 2–6 weeks), installation (1–3 days for a standard 8 kW residential job), city/county inspection, utility meter swap, and energization. The homeowner's actual obligations: provide attic and panel access for the survey, be reachable for scheduling, and not much else.
Two process warnings. First, the meter swap gap: between inspection sign-off and utility PTO, your system sits ready but legally dark — resist any installer who energizes early, because an un-permissioned backfeed can void the interconnection agreement. Second, document everything at commissioning: serial numbers, warranty registrations, the as-built string map, and baseline production. The solar installation guide has the full homeowner checklist.
Net Metering Structures: Know Which World You Live In
| Structure | Export Value | Optimal System Sizing | Storage Pairing |
|---|---|---|---|
| Full retail net metering (1:1) | Retail rate, kWh-for-kWh | Size to 100%+ of annual usage | Optional — grid acts as the battery |
| Net metering with fixed fees / minimum bills | Retail, minus $10–$40/month floor | Size to usage; fees cap achievable savings | Optional |
| Net billing / avoided-cost export | $0.03–$0.08/kWh | Size to daytime base load (60–80% of usage) | Strong — storage converts exports to self-consumption |
| Time-of-use net metering | Retail, but rate varies by hour | West-facing tilts gain value; evening peaks change the shape | Strong — arbitrage adds a second value stream |
The same 8 kW system on the same roof is a 7-year payback under the first row and a 14-year payback under the third. Structure, not sunshine, is the biggest economic variable in residential solar in 2026.
Storms, Insurance, and the Worst-Case File
Homeowners insurance typically covers roof-mounted solar as part of the dwelling — call your carrier, add the system to the policy (usually $15–$40/year of premium), and confirm hail coverage terms before a storm tests them. Panels themselves are tested to UL 61730 hail standards (25 mm ice balls at 23 m/s, roughly one-inch hail at 50+ mph) and survive far worse in field data; the 2024 Texas hail events destroyed some arrays while neighbors' panels of the same vintage survived — the differentiator was module quality and racking, not luck. Keep your serial-number list and photos of the installation; claims move dramatically faster with documentation. For hurricane zones, the racking attachment schedule (not the panel) is the engineering item — ask for the stamped letter and keep it with the policy.
Alternatives When Your House Fails the Test
Three legitimate paths exist for homes that flunk the physical screen. Community solar subscriptions deliver 5–15% bill discounts with no roof, no equipment, and no tenure requirement — the right answer for renters and shaded homes in the ~20 states with active programs. Ground mounts solve bad roofs where land exists, at a $0.20–$0.50/W premium. Efficiency-first is the unglamorous answer for low-usage homes: a $4,000 heat-pump water heater and attic insulation can beat a $24,000 solar array on pure payback when bills are small. A good advisor tells you which of these you are. For a straight look at full-coverage feasibility, see can solar panels power a whole house.
The Decision Checklist We Use on Site Visits
- Blended rate above $0.15/kWh? (Or strong state incentives closing the gap?)
- 5+ peak sun hours, or 4+ with high rates?
- South, east, or west roof plane with 15+ years of life?
- Minimal shading from 9 AM to 3 PM?
- Usage above 500 kWh/month?
- Planning to stay 7+ years, or in a market that credits owned solar at sale?
- Utility offers retail or near-retail net metering?
Score it honestly: 6–7 yeses is a clear buy, 4–5 is a "run the numbers carefully," and under 4 is a "not this house, not now." I have walked customers through this list at their kitchen tables for years, and the list has never lied — the times it said no and they bought anyway are the complaint calls I still remember.
Planning for the Loads You Do Not Have Yet
The smartest sizing question in 2026 is not "what do I use now?" but "what will I use in five years?" Three future loads change residential solar math materially. An EV adds 250–400 kWh/month (roughly 3–4 miles per kWh × your annual miles) and turns a marginal solar case into a strong one, because you are replacing $0.12–$0.16/kWh gasoline-equivalent miles with $0.05/kWh solar ones. Heat-pump conversions — space heating and water heating — add 200–600 kWh/month while eliminating a gas bill, and they make solar the fuel supply for the whole house rather than just the lights. And a hot tub, pool, or workshop addition each adds their own block. If any of these is a genuine five-year plan, size the array and the electrical panel for the future load now. Retrofitting capacity later costs far more than building it in: a second array re-pays permitting, mobilization, and interconnection costs that a right-sized first array pays once. The solar system calculator lets you model added loads directly.
The Environmental Ledger, Without the Fog Machine
An 8 kW system in average U.S. sun produces about 10,500 kWh/year. At the U.S. grid average of roughly 0.85 lb of CO₂ per kWh, that is about 8,900 lb — over four metric tons — of avoided emissions annually, every year, for three decades. Over a 30-year life that is roughly 120 tons of CO₂ per house. The manufacturing footprint is real but small: lifecycle analyses put solar's full embodied emissions at 20–50 g CO₂ per kWh delivered, versus 400–1,000 g for fossil generation, so the array repays its own manufacturing carbon in one to two years of operation. Panels are largely recyclable — glass, aluminum, copper, and silicon all have recovery streams — and the industry's recycling infrastructure is scaling as the first large wave of retirements arrives this decade. None of this requires belief, just arithmetic: the environmental case for a sunny, high-usage home is as strong as the financial one, and in low-rate states it is often stronger.
Choosing the Installer: The Variable That Outweighs Equipment
Two identical 8 kW systems with identical panels can produce 20%-different 25-year outcomes based entirely on installation quality — wire management, flashed penetrations, string design, and commissioning rigor. Screen installers on five things: years in business under the same license (warranty promises are only as durable as the company), NABCEP-certified staff on the actual crew rather than just on the brochure, a workmanship warranty of 10+ years in writing, named monitoring included in the base price, and local references you can actually call. Then do the thing nobody does: check the contractor license and complaint history with your state board — five minutes that filters out the worst 5% of the market.
Get three quotes, insist each includes the production assumptions in writing (azimuth, tilt, shade percentage, derate factor), and compare the $/W against the scope rather than the sticker. The middle bid with complete documentation beats the low bid with asterisks nearly every time I have watched a project through to year five. And be honest about DIY: equipment kits from our DIY solar kits collection plus a licensed electrician for the service work is a legitimate path for handy owners of simple roofs — but it trades $6,000–$10,000 of savings for your own project management, and the first permitting cycle teaches most people what that trade is worth.
Warranties Decoded: The Three You Actually Own
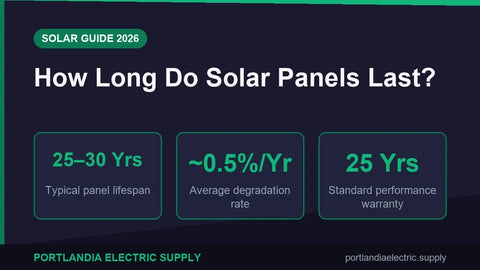
Every residential solar purchase carries three separate warranties, and conflating them is how owners get surprised. The panel product warranty (12–25 years) covers manufacturing defects in the module itself. The performance warranty (25–30 years) guarantees a degradation schedule — typically no more than 1–2% loss in year one and 0.4–0.55% per year after, guaranteeing 84–87% output at year 25; read whether labor for replacement is included, because a free panel plus a $900 truck roll is not a free repair. The workmanship warranty from your installer (5–25 years, 10 is standard) covers the roof penetrations, wiring, and racking — the things that actually leak. Ask each bidder one question: "In year nine, a panel dies and a conduit fitting leaks — who pays what, in writing?" The installers with clean answers to that question are the ones worth paying. See our energy storage overview if you are also weighing a battery against these same warranty lenses.
Frequently Asked Questions
Is solar worth it without the federal tax credit?
In states with electricity rates above roughly $0.15/kWh, yes — payback runs 9 to 14 years against a 25-year warranty. Below $0.11/kWh with no state incentives, the math rarely works. The credit's 2025 sunset raised paybacks roughly 40% but did not flip the answer in high-rate states.
How long do solar panels actually last?
Modern modules carry 25-year performance warranties guaranteeing 84–87% of original output at year 25, and field data shows panels producing for 35+ years. Budget for one string-inverter replacement around years 12–15; microinverters carry 25-year warranties.
Does solar increase home value?
Owned systems with documentation do — studies have found premiums around $4 per watt, though real-world appraisals vary. Leased systems add little or nothing and can complicate a sale. Ownership and paperwork are what the premium attaches to.
What if my roof is shaded part of the day?
Partial shade is a design problem, not a dealbreaker. Microinverters or DC optimizers contain shade losses to the affected modules. Heavy all-day shade on every viable plane is the true disqualifier — ground mounts solve it where land allows.
Is solar worth it in cloudy states like Washington or Oregon?
Marginally. Seattle delivers about 55% of Phoenix's per-kW production, but Northwest rates and summer net-metering banks keep payback in the 12–16 year range. It works for high-usage homes planning long tenure; it is not the high-rate slam dunk California or the Northeast offers.
Should I wait for better panel technology?
No. Panels improve roughly 0.3–0.5 percentage points of efficiency per year while your bills run at full price. A year of waiting in a $0.20/kWh state costs an 8 kW household about $2,300 in foregone savings — more than any single year's technology gain has ever been worth.