The average American homeowner saves $1,300–$2,600 per year with solar panels, and $35,000–$65,000 over 25 years after recovering the system's cost. The range is wide because savings are multiplication, not magic: annual savings = system kW × effective peak sun hours × 365 × 0.86 × your electricity rate, minus anything you still buy from the utility. States with expensive power and decent sun — California, New York, Massachusetts, Hawaii — dominate the savings league table, while cheap-power states pay back slowly no matter how sunny the marketing brochure looks. Here is the honest arithmetic, state by state, with every formula shown so you can rerun it on your own bill.

How Solar Savings Actually Accrue
Two streams make up your savings. The big one is avoided purchases: every kWh your panels make and your house uses instantly is a kWh you never buy at retail — worth the full 12–31¢/kWh depending on state. The smaller, more conditional stream is export credit: surplus energy pushed to the grid, credited anywhere from full retail (true 1:1 net metering, increasingly rare) down to 2–4¢/kWh avoided-cost rates. Where exports pay poorly, system design shifts toward self-consumption and batteries. Where they pay fully, the grid is your free battery. Know which tariff you live under before believing any savings projection; the state incentives and policy page tracks the net-metering status that drives this.
The Master Formula, Worked
Take an 8kW system on a New Jersey roof at 4.2 effective PSH with a 21¢/kWh utility rate: 8 × 4.2 × 365 × 0.86 = 10,551 kWh/yr. If the household uses 11,500 kWh, essentially all production self-consumes or nets at retail: 10,551 × $0.21 = $2,216/yr. Same 8kW in western Washington at 3.5 PSH and a 12¢ rate: 8 × 3.5 × 365 × 0.86 = 8,795 kWh × $0.12 = $1,055/yr — less than half, on identical hardware. Sun matters, but rate matters more, and I've had to deliver that unwelcome news to more than one Pacific Northwest customer.
Savings by State: 2026 Reference Table
Modeled on an 8kW system, full retail offset, approximate average residential rates. Your rate is on your bill's second page — use it, not these averages, for decisions:
| State | Avg. Rate (¢/kWh) | Effective PSH | 8kW Annual kWh | Annual Savings |
|---|---|---|---|---|
| California | 31 | 5.2 | 13,055 | $4,047 |
| Hawaii | 39 | 5.0 | 12,558 | $4,898 |
| Massachusetts | 28 | 3.9 | 9,794 | $2,742 |
| New York | 24 | 4.0 | 10,051 | $2,412 |
| New Jersey | 21 | 4.2 | 10,551 | $2,216 |
| Arizona | 16 | 5.5 | 13,812 | $2,210 |
| Colorado | 15 | 5.3 | 13,320 | $1,998 |
| Texas | 15 | 5.0 | 12,558 | $1,884 |
| Florida | 15 | 4.9 | 12,307 | $1,846 |
| Illinois | 17 | 4.0 | 10,051 | $1,709 |
| Georgia | 14 | 4.6 | 11,559 | $1,618 |
| Washington | 12 | 3.5 | 8,795 | $1,055 |
Check the California row: 8 × 5.2 × 365 = 15,184; × 0.86 = 13,058 (rounding to 13,055 in the table); × $0.31 = $4,047. Hawaii's rate does the heavy lifting despite mid-tier sun. Washington's cheap hydro power makes solar a values purchase more than a financial one — we sell systems there, but we sell them honestly.
What the 30% Federal Credit Does to the Math
The Investment Tax Credit rebates 30% of the total installed cost — panels, inverter, racking, labor, permits, and batteries of 3kWh or more — as a dollar-for-dollar tax credit. It transforms payback arithmetic:
| Scenario (8kW turnkey @ $2.90/W) | Gross Cost | Net After ITC | Annual Savings | Flat Payback |
|---|---|---|---|---|
| California | $23,200 | $16,240 | $4,047 | 4.0 yrs |
| New York | $23,200 | $16,240 | $2,412 | 6.7 yrs |
| Texas | $23,200 | $16,240 | $1,884 | 8.6 yrs |
| Georgia | $23,200 | $16,240 | $1,618 | 10.0 yrs |
| Washington | $23,200 | $16,240 | $1,055 | 15.4 yrs |
Layer state credits on top — New York's 25% credit capped at $5,000, for instance, pulls the NY row's net to $11,240 and payback under 5 years — and the strong-policy states get compelling fast. Utility rates rise over time while your sunlight stays free, so every flat payback figure here is conservative; 3%/yr escalation shortens each by 12–18%. The payback calculator and ROI calculator let you flex both assumptions.
25-Year Savings: The New Jersey Case, Year by Year

Long-range tables are where marketing gets creative, so here are the assumptions on the table: 10,551 kWh in year 1, degradation 0.5%/yr, utility escalation 3%/yr, net cost $16,240. Both rates of change are historical norms, not hopes.
| Year | Production (kWh) | Rate (¢/kWh) | Savings | Cumulative Net of Cost |
|---|---|---|---|---|
| 1 | 10,551 | 21.0 | $2,216 | −$14,024 |
| 5 | 10,342 | 23.6 | $2,440 | −$4,550 |
| 8 | 10,184 | 25.7 | $2,617 | +$3,020 |
| 10 | 10,078 | 27.3 | $2,751 | +$8,430 |
| 15 | 9,818 | 31.7 | $3,112 | +$23,150 |
| 20 | 9,563 | 36.8 | $3,520 | +$39,900 |
| 25 | 9,315 | 42.7 | $3,977 | +$58,800 |
Breakeven lands in year 8, and the system then spends 17+ years printing $2,600–$4,000 annually. Scale those savings by the degradation and escalation assumptions of your choice — a 2% escalation world cuts the 25-year total to roughly $46,000, still a 2.8× return on net cost. The conclusion is robust to the assumptions, which is what separates an investment from a pitch.
Five Factors That Move Your Number Most
Your rate and its trajectory. Every 5¢/kWh of rate is worth about $500/yr on an 8kW system. Self-consumption ratio. Under weak export rates, shifting laundry, dishwashing, and EV charging into daylight hours is worth more than any hardware upgrade — free savings with a timer. Shade. A 15% production haircut is a 15% savings haircut, permanently; it is the one factor you cannot negotiate with later. Financing drag. Dealer fees and interest come straight out of the savings column — details in the next section. System life discipline. A $2,000 inverter replacement in year 14 and two cleaning visits a decade are the whole maintenance story across a quarter-century of ownership if you bought decent hardware; cheap no-name inverters rewrite that story unkindly, which is why our kit BOMs at complete solar kits stick to bankable brands.
How Financing Eats Savings
| Path ($23,200 gross, NJ savings $2,216/yr) | Total Cost of Money | Effective Net Cost | Real Payback |
|---|---|---|---|
| Cash | $0 | $16,240 | 7.3 yrs |
| Solar loan, 10 yr, 7.5%, no dealer fee | ~$9,800 interest | ~$26,000 | 11.7 yrs |
| Solar loan with 25% dealer fee (priced into principal) | ~$29,000 financed; ~$12,200 interest | ~$29,000 net of ITC on inflated principal* | 13+ yrs |
| Lease / PPA, 2.9% escalator | 25-yr payments ~$52,000 | You never own it; lessor keeps ITC | Savings = payment gap only, ~$8,000–$14,000 over 25 yrs |
*The dealer-fee trick deserves the asterisk: the installer quotes "$0 down, payment lower than your bill," inflates the financed principal 20–30% to pay the lender's origination fee, and your ITC is calculated on the inflated number — so the IRS subsidizes the fee, but you still repay it with interest. I have reviewed contracts where the financed principal implied $5.10/W for hardware I sell at $1.60/W wholesale. Cash or a plain home-equity loan preserves the economics; everything else needs the amortization schedule read aloud before signing.
Batteries: When Storage Raises Savings
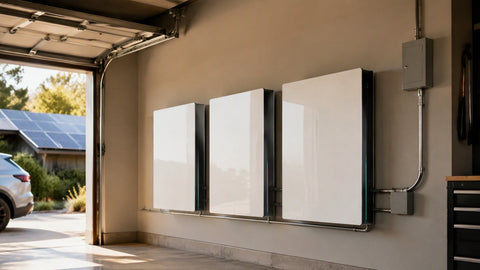
Under full retail net metering, a battery is a resilience purchase, not a savings one — the grid already stores for free. Under California-style export rates of 3–8¢ against 30¢+ evening imports, a 10–13.5kWh battery capturing 8–10 kWh of daily surplus adds $700–$1,100/yr of value and changes the payback conversation entirely. Run both scenarios with your own tariff sheet in hand, not a national average; the battery buyer's guide and our 10kWh battery options price the hardware side, and the runtime calculator sizes it against your outage expectations.
The Home-Value Bonus
Lawrence Berkeley National Laboratory's multi-state study of home sales found buyers paid a premium of roughly $4 per installed watt for homes with owned solar — about $24,000 on a 6kW system, often exceeding the net system cost on day one. Leased systems do not carry the premium and sometimes complicate sales. Owned solar, documented with permits and production history, is the rare home improvement that can return more than 100% at closing while paying you annually until then.
Reading a Savings Projection Like an Auditor

Every installer proposal contains a 25-year savings figure, and every one of them is an assumption stack. Five dials control the output: year-1 production (demand effective PSH, stated), degradation (0.5%/yr for standard mono, 0.25% for premium N-type), utility escalation (2–3% is defensible; 5%+ is storytelling), export compensation (must match your actual tariff), and the discount rate, if they show NPV (3–5% is reasonable). Change any dial and the 25-year number swings by five figures. When two quotes' savings projections differ wildly on identical hardware, the assumptions — never the panels — are the difference, and the proposal that hides its assumptions is telling you something.
Taxes, SRECs, and Other Income Streams
Savings beyond bill offset exist in specific markets. SREC states (New Jersey, Maryland, DC, Pennsylvania, Illinois among them) pay per megawatt-hour generated — an 8kW system mints roughly 9–11 SRECs/yr, worth $20–$200 each depending on the state's market, or $400–$2,000/yr of extra income. Some states exempt the added home value from property tax (most do) or sales-tax the equipment (many don't). The stack is state-specific enough that we maintain the incentives page as a living document — check it rather than trusting any article, including this one, for your state's current rules.
Three Real Household Scenarios
The Phoenix retiree. 9,800 kWh/yr usage, 5.6 PSH, 16¢ rate. A 6kW system covers ~94% of consumption: savings ~$1,480/yr, net cost ~$10,800 after ITC (wholesale kit plus hired electrician), payback 7.3 years, and full offset of summer AC bills from year one. The Long Island family. 13,200 kWh/yr, 4.1 PSH, 26¢ rate, 10kW turnkey. Savings $3,230/yr year one, net cost $15,400 after federal and state credits, payback under 5 years, plus ~$900/yr of SREC income on top. The Seattle skeptic. 9,600 kWh/yr, 3.4 PSH, 12¢ rate. An 8kW system saves ~$990/yr against a $16,240 net cost — 16-year payback, justified by resilience and values, not ROI. We quoted it honestly, they bought it knowingly, and everyone sleeps fine. That is how these conversations should go.
Frequently Asked Questions
How much money do solar panels save per month?
Typically $110–$220/month for an 8kW system, depending on your rate and sun — the state table above converts both into dollars. Savings are highest in summer production months.
Do solar panels eliminate the electric bill entirely?
Usually not. Fixed connection charges ($8–$25/month) remain, and winter shortfalls buy some grid power in cloudy climates. Most well-sized systems cut bills 80–95% annually.
How much does solar save over 25 years?
$35,000–$65,000 net of system cost for typical 8–10kW systems at average-to-high rates, assuming 0.5%/yr degradation and 3%/yr rate escalation. High-rate states exceed the range; cheap-power states fall below it.
Are solar savings taxable?
Bill savings are not income and are not taxed. SREC income is generally taxable. The federal ITC is a credit, not a deduction — worth 30¢ per dollar of cost directly against tax owed.
Do solar panels still save money without net metering?
Yes, but design shifts: self-consumption plus battery storage replaces export value. Savings of 60–75% of the net-metered case are typical with a well-matched 10kWh battery.
What happens to savings if electricity rates fall?
Savings shrink proportionally — rates are a multiplier on every kWh. Rates have risen at roughly 2–3%/yr for two decades nationally, which is why projections use escalation, but a flat-rate world still pays back most systems within 12–15 years.
Your Bill's Anatomy: What Solar Can and Cannot Erase
Read a bill closely and savings stop being abstract. A typical residential statement splits into a fixed customer charge ($8–$25/month — solar never touches this), an energy charge per kWh (the part solar erases), and riders for transmission, fuel adjustment, and taxes, which scale with kWh purchased and shrink as purchases shrink. On time-of-use tariffs, the kWh price itself moves by the hour — 12¢ overnight, 34¢ from 4–9pm — which is why west-facing arrays and batteries punch above their energy weight on TOU plans: they attack the expensive hours specifically. Run your tariff's actual numbers through the cost-per-kWh calculator if your bill bundles charges confusingly — many do, deliberately or not.
How Much of Your Bill Should You Offset?

Target 100–110% of annual usage, no more. Past that point every marginal kWh earns the export rate, and in avoided-cost territories that is 2–4¢ against a 15¢+ retail — a terrible trade that also invites utility interconnection pushback above 120% of documented usage. Under-building is equally wasteful in the other direction: permits, engineering, and mobilization are fixed costs, so the last panel you add is the cheapest energy on your roof. The exception is known load growth — an EV on order, a heat-pump conversion scheduled — where sizing to the future load at install is far cheaper than expanding later. The system calculator models both directions.
Savings at Three Household Scales
| Household | Annual Usage | Right-Sized System | Production @ 4.5 PSH | Annual Savings @ 17¢ |
|---|---|---|---|---|
| Efficient condo/townhome | 6,000 kWh | 4.8kW | 6,781 kWh | ~$1,020 (capped at usage) |
| Average single-family | 10,800 kWh | 8.6kW | 12,148 kWh | ~$1,836 (capped at usage) |
| Large all-electric home + EV | 16,500 kWh | 13.1kW | 18,510 kWh | ~$2,805 |
The middle row's math, shown so you can audit it: 8.6 × 4.5 = 38.7; × 365 = 14,126; × 0.86 = 12,148 kWh of annual production. Savings are capped at consumption — 10,800 × $0.17 = $1,836 — because surplus beyond annual usage earns only the lower export rate. Rerun any row with the output calculator for your own address. What survives every recalculation is the shape: savings scale with usage and rate, and cap at what you actually consume. Households above 1,400 kWh a month should also read the 12kW cost guide on this blog, because bigger systems buy their watts at a lower price per watt and the savings compound accordingly.
Community Solar and Green Tariffs: The Comparison
Renters and shaded-roof owners still have an offset path. Community solar subscriptions typically discount your share of a solar farm's output by 5–15% off retail — real but modest savings, nothing like rooftop ownership economics, and with zero home-value effect. Utility green tariffs are worse financially: you usually pay a premium for renewable certificates rather than saving anything. Neither competes with owned rooftop solar on a 25-year view; they exist for people the roof physically excludes. If you own a suitable roof, ownership wins so decisively that the comparison barely merits the paragraph.
What Eats Savings After Installation
The post-install threats are mundane, not technical. Trees grow: a sapling at install is a shade problem by year 8, and trimming is cheaper than accepting a production haircut. Monitoring goes unwatched: a failed optimizer or a tripped string can silently cost $40–$70/month for seasons before anyone looks at the app — set a monthly calendar reminder to glance at production. Rate plans change: utilities restructure tariffs, and the plan that was optimal at install may not be in year 3; an annual rate-plan review is worth an hour. The maintenance guide covers the physical side; the financial side is mostly about paying attention. I have seen more savings lost to ignored monitoring alerts than to hardware failures — the panels are reliable, but nobody's spreadsheet checks itself.
Solar vs. a Generator: Different Savings Entirely
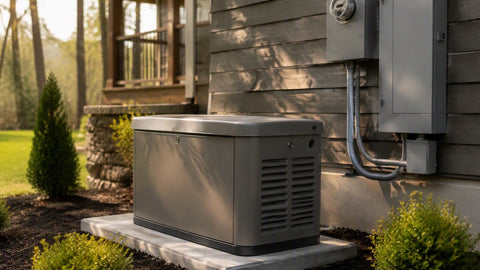
Customers sometimes cross-shop solar against standby generators, and the comparison confuses two products. Solar saves money every sunny day; a generator spends money (fuel, maintenance) to buy resilience during outages. A 22kW standby unit burns roughly 3.6 gallons of propane or 240 cubic feet of natural gas per hour at full load — an outage asset, not a savings asset. The overlap is the hybrid path: solar plus battery, sized with the battery sizing calculator, covers most outage hours at zero fuel cost and all sunny days at negative cost. Different tools, different math; buy each for what it actually does. The energy storage explainer maps the middle ground clearly.
Solar as an Inflation Hedge
One framing homeowners consistently undervalue: buying a system is pre-purchasing 25–30 years of electricity at a fixed price. Compute it directly — $16,240 net ÷ ~240,000 lifetime kWh (8kW, NJ sun, degraded) ≈ 6.8¢/kWh locked, against a utility rate that starts at 21¢ and historically drifts upward. Every rate hike after install increases your savings automatically; your neighbor's complaint about this summer's rate case is your dividend. No bond, CD, or utility budget-billing plan offers that asymmetry, and it is why solar owners describe their bills with a calm that non-owners find faintly annoying.
The First-Year Checklist That Protects 25 Years of Savings
Five habits, established in year one, protect the entire asset. Benchmark the first full month against the installer's model; a 10% shortfall in month one means shading, wiring, or orientation issues that warranty visits fix free now and expensively later. Photograph the array and label the disconnects — future roofers, electricians, and home buyers all need to know what is up there. File the ITC correctly (IRS Form 5695) and keep the invoice; audits are rare but the paperwork defense is trivial if kept. Register every warranty — module, inverter, racking, workmanship — with serial numbers in one folder. Review your rate plan annually, as utilities restructure TOU windows and a 15-minute annual review keeps the array aimed at the most expensive hours. None of this is heroic; all of it compounds.
Bottom Line
Solar savings are multiplication you can verify: kW × sun hours × 0.86 × your rate, capped at your consumption, netted against a cost the federal government immediately discounts by 30%. High-rate states bank $2,500–$4,900 a year; average-rate states bank $1,600–$2,200; the 25-year totals run $35,000–$65,000 with financing choices — not hardware — deciding which end of the range you land on. Audit the assumptions, own the system, watch the monitoring app, and the arithmetic does the rest. One last number worth memorizing: the typical 8kW owner who buys right in 2026 will pay less for three decades of electricity than their neighbor pays the utility in the next six years alone — that gap, compounding quietly, is the entire argument. When you are ready to run your own numbers against real hardware pricing, start at the complete go-solar guide or bring your bill to our team for a no-theater quote.
Regional Quirks That Bend the Curve
Three market structures reward local knowledge. In California's NEM 3.0 territory, exports pay avoided-cost rates that crater midday value, so the savings-maximizing design pairs a right-sized array with storage and aims loads at daylight hours — self-consumption ratios above 80% are the goal, and battery-less systems now pay back years slower than their 2020 counterparts did. In Texas's deregulated market, your retail plan matters more than your roof: solar buyback plans paying near-retail for exports exist alongside plans paying nothing, and switching plans after install is normal practice — shop the plan as seriously as the panels. In the SREC belt (NJ, MD, DC, PA, IL), generation itself is a revenue stream separate from bill offset, which is why paybacks there run years faster than the raw rate math suggests. Wherever you live, the pattern repeats: tariff literacy is worth more than panel brand preference, and an hour spent understanding your utility's rules out-earns any hardware upgrade we sell. We put this section in every savings consultation we run, because the customers who grasp it stop asking "which panel is best" and start asking "which tariff am I on" — and the second question is the one that actually fills the savings column.