Whether you're a contractor quoting a residential rooftop job or a homeowner exploring energy independence, understanding hourly solar output is the foundation of smart system design. A solar panel's nameplate wattage tells you what it can produce — but what it actually delivers changes every hour based on sunlight intensity, temperature, weather, and installation quality. At PES Supply, we help thousands of installers, developers, and property owners across the nation select the right Tier 1 panels and components — and that starts with knowing exactly how much power those panels will deliver, hour by hour. Browse our full lineup of solar panels to see these technologies in action.
This guide breaks down real-world power generation rates using the same panels and equipment we stock and ship daily from our Louisville, KY facility and nationwide distribution network. We'll cover the science behind hourly output, walk through residential and commercial system examples, show how weather and seasons shift production, and give you the installation and storage strategies that maximize every watt.
⚡ Key Takeaways
- Residential Panels: Tier 1 monocrystalline modules produce 370–420 watts per hour of peak sunlight — up to 580W+ for commercial bifacial panels.
- Daily Output: A single 400W panel generates 1,600–2,400 Wh per day depending on your location's peak sun hours (4–6 hours).
- Bell Curve Pattern: Output follows a predictable arc — rising from ~10% at 7 AM, peaking at 100% around solar noon, and dropping to ~6% by 6 PM.
- Weather Impact: Heavy clouds reduce output by 65–85%, but panels still produce. Light clouds cut only 20–40%.
- Seasonal Swing: Summer delivers 80–100% of rated capacity; winter drops to 25–50% due to shorter days and lower sun angles.
- Maximize Output: Proper orientation, tilt, shading elimination, and inverter selection can boost real-world hourly production by 10–25%.
In This Guide:
Solar panels convert sunlight into direct-current (DC) electricity through the photovoltaic effect. The amount of power any panel produces in a given hour depends on its wattage rating, the intensity of available sunlight, and site-specific conditions like shading, orientation, and temperature. Understanding these variables is essential for accurate system sizing, financial projections, and setting realistic expectations with clients or for your own home.
What Affects Hourly Power Output?
Here are the primary variables that determine how many watts your panels will actually deliver on any given hour of any given day:
Sunlight intensity is the single biggest driver. Brighter, more direct sunlight produces more electricity. Midday sun in summer delivers peak output, while early morning, late afternoon, and overcast skies reduce it substantially. The industry standard for rating panels — Standard Test Conditions (STC) — assumes 1,000 watts per square meter of irradiance, which is roughly equivalent to direct midday sun on a clear day.
Panel wattage and efficiency define the ceiling of what's possible. A 400W Tier 1 module from brands like Jinko, Trina, or LONGi will outperform a generic 250W panel significantly — not just in peak watts, but in real-world energy harvested across varying light conditions thanks to superior cell technology and lower degradation rates.
Orientation and tilt angle determine how directly sunlight strikes the panel surface. South-facing panels in the Northern Hemisphere at a tilt angle matching your latitude capture the most annual sunlight. Even small deviations — an east-facing roof or a suboptimal tilt — can reduce annual production by 10–25%.
Temperature has a counterintuitive effect: solar cells lose efficiency in extreme heat. Most panels lose 0.3–0.5% of output per degree Celsius above 25°C. Well-ventilated mounting with adequate roof clearance keeps panels cooler and more productive — components we stock and ship alongside every panel order.
Weather and shading create the most dramatic hour-to-hour swings. Cloud cover, nearby trees, chimneys, and building shadows all reduce the sunlight reaching the panel surface. Even partial shading on a single cell can reduce output for an entire string in traditional string-inverter systems.
Typical Power Generation by Panel Type
The panels we supply at Portlandia Electric range from standard residential modules to high-output commercial and bifacial panels. Here is what you can expect per panel, per hour of peak sunlight:
| Panel Category | Output per Hour (Peak Sun) | Brands We Carry |
|---|---|---|
| Residential Monocrystalline | 370–420 W | Jinko, Canadian Solar, REC, Aptos |
| Commercial Monocrystalline | 400–580 W | Trina, LONGi, HD Hyundai, Jinko |
| Bifacial (Commercial) | 450–600+ W | Trina Vertex, LONGi Hi-MO, Jinko Tiger Neo |
| Budget / Value Tier | 250–350 W | Znshine, Phono Solar, Bluesun |
💡 Pro Tip: Why Tier 1 Panels Matter for Hourly Output
Tier 1 panels consistently deliver closer to their rated wattage under real-world conditions — not just at STC. That reliability translates to more predictable project ROI for your clients and fewer callbacks for you. When a datasheet says 400W, a Tier 1 module from our inventory will actually produce close to 400W at peak, while budget panels often fall 5–10% short even in ideal conditions.
This distinction is fundamental to every solar conversation — and it's where many homeowners and even some newer contractors get tripped up. Watts (W) measure instantaneous power output — how much electricity a panel produces at a specific moment. Watt-hours (Wh) measure total energy produced over time. For example, a 400W panel operating at full output for 1 hour generates 400 Wh. Over 5 peak sun hours, that same panel delivers 2,000 Wh (2 kWh). Your electricity bill is measured in kWh — so watt-hours are what ultimately determine savings and ROI.
| Term | What It Measures | Real-World Example |
|---|---|---|
| Watts (W) | Power at a single moment | A Jinko Tiger Neo produces 580 W at peak |
| Watt-hours (Wh) | Total energy produced over time | 580 W × 5 peak sun hours = 2,900 Wh (2.9 kWh) |
| Kilowatt-hours (kWh) | Standard billing unit (1,000 Wh) | Average U.S. home uses ~30 kWh/day |
🔬 Why This Matters for System Sizing
"A homeowner who uses 30 kWh per day needs a system that produces 30,000 Wh daily — not 30,000 W of instantaneous capacity. With 5 peak sun hours and an 8 kW system (20 × 400W panels), daily production is roughly 8,000W × 5h = 40,000 Wh (40 kWh) — enough to cover usage with margin for cloudy days, system losses, and degradation."
Peak sun hours represent the number of hours per day when solar irradiance averages 1,000 watts per square meter — the standard test condition for panel ratings. This is not the same as total daylight hours. A location may have 14 hours of daylight in summer, but only 5–6 of those hours deliver irradiance intense enough to count as "peak." The number of peak sun hours at your project site directly determines daily energy yield.
A system in Phoenix, AZ (6+ peak hours) will produce substantially more energy annually than the same system in Seattle, WA (3.5–4 peak hours). This is one of the most important inputs for any production estimate or financial model — and it varies dramatically across the regions our customers operate in.
| Panel Wattage | Peak Sun Hours | Daily Output (Wh) | Annual Estimate (kWh) |
|---|---|---|---|
| 400 W | 4 hours | 1,600 Wh | ~584 kWh |
| 400 W | 5 hours | 2,000 Wh | ~730 kWh |
| 400 W | 6 hours | 2,400 Wh | ~876 kWh |
| 580 W | 5 hours | 2,900 Wh | ~1,059 kWh |
⚠️ Don't Confuse Daylight Hours with Peak Sun Hours
A common mistake in solar proposals is using total daylight hours (10–14 hours) instead of peak sun hours (3.5–6 hours) for production estimates. This dramatically overstates expected output and leads to disappointed customers. Use NREL's PVWatts Calculator or equivalent modeling tools with actual local irradiance data for accurate production projections. Your PES Supply rep can help you identify the right peak sun hour values for your project's zip code.
Solar output is not flat. It follows a predictable bell curve that peaks around solar noon and tapers off in the morning and late afternoon. Understanding this pattern helps contractors properly size inverters, helps homeowners plan energy-intensive tasks like EV charging and laundry during peak production windows, and helps commercial facility managers align operations with free solar electricity.
Residential System Example: 8 kW (20 × 400W Panels)
A typical residential installation using 20 of our 400W monocrystalline panels from manufacturers like Jinko or Canadian Solar. This represents one of the most common system sizes for U.S. homes with average electricity consumption of 25–35 kWh/day.
| Time of Day | Approx. Output (kW) | % of Peak |
|---|---|---|
| 7:00 AM | 0.8 kW | 10% |
| 9:00 AM | 4.0 kW | 50% |
| 11:00 AM | 7.2 kW | 90% |
| 12:00 PM (Solar Noon) | 8.0 kW | 100% |
| 2:00 PM | 7.0 kW | 88% |
| 4:00 PM | 4.0 kW | 50% |
| 6:00 PM | 0.5 kW | 6% |
Commercial System Example: 100 kW Ground-Mount or Rooftop
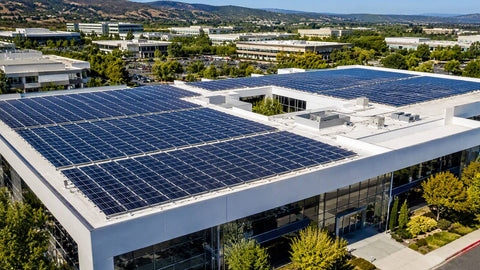
For a commercial rooftop or ground-mount installation using high-efficiency Trina Vertex or LONGi Hi-MO modules — the type of system we supply to EPCs and developers across the country. Commercial systems follow the same bell curve pattern but at a much larger scale.
| Time of Day | Approx. Output (kW) | % of Peak |
|---|---|---|
| 7:00 AM | 10 kW | 10% |
| 9:00 AM | 55 kW | 55% |
| 12:00 PM (Solar Noon) | 100 kW | 100% |
| 3:00 PM | 70 kW | 70% |
| 6:00 PM | 8 kW | 8% |
💡 Pro Tip: Inverter Clipping and Oversizing
Many experienced installers intentionally oversize the panel array relative to the inverter capacity (a DC-to-AC ratio of 1.1–1.3). This means the array may produce more DC power than the inverter can convert during the brief midday peak, but it captures significantly more energy during the morning and afternoon shoulders of the bell curve — where most of the day's "missed" energy actually lives. Ask your PES Supply rep about optimal inverter pairing for your specific array configuration.
Real-world conditions rarely match laboratory standard test conditions. Weather patterns and seasonal changes create significant variation in hourly and daily output — and understanding these patterns is essential for setting accurate expectations and designing resilient systems. Here is how conditions affect the panels we supply.
Cloud Cover Effects
Clouds block and scatter sunlight, reducing the irradiance reaching your panels. The impact varies dramatically depending on cloud thickness and type. Importantly, panels never stop producing entirely — even under heavy overcast, diffuse light still generates meaningful output.
| Sky Condition | Output vs. Clear Sky | What's Happening |
|---|---|---|
| Clear / Direct Sun | 100% | Ideal conditions — panels operate at or near rated output |
| Light / Scattered Clouds | 60–80% | Diffuse light still generates substantial power; intermittent cloud edges can briefly boost irradiance |
| Heavy Overcast | 15–35% | Reduced but meaningful output — panels are still working |
| Rain / Storm | 5–20% | Minimal but non-zero; rain also cleans panels, improving next-day output |
Seasonal Variation
The amount of sunlight changes dramatically with the seasons. Days are longer in summer with higher sun angles, delivering more peak sun hours and more total energy. Winter brings shorter days, lower sun angles, and the potential for snow coverage — all of which reduce output. Spring and fall often deliver the best combination of decent sun hours and cool temperatures (which actually improve panel efficiency).
| Season | Peak Sun Hours | Relative Output | Key Consideration |
|---|---|---|---|
| Summer | 5–7+ hours | 80–100% | Longest days and highest irradiance; extreme heat can slightly reduce efficiency (0.3–0.5%/°C above 25°C) |
| Spring / Fall | 4–6 hours | 55–80% | Often ideal panel temperatures — cooler air maximizes cell efficiency during moderate sun hours |
| Winter | 2.5–4.5 hours | 25–50% | Shorter days, lower sun angle, potential snow coverage; reflected snow light can partially offset losses |
Temperature Effects on Hourly Output
Temperature has a counterintuitive relationship with solar output. While more sunlight generally means more heat, hotter panels actually produce less electricity per watt of irradiance. Most panels lose approximately 0.3–0.5% of output for every degree Celsius above the 25°C standard test temperature. On a 40°C (104°F) day when cell temperatures reach 60°C or higher, a 400W panel might produce only 370W. This is why proper racking with airflow clearance beneath the panels — components we also supply — is critical for maximizing real-world output.
⚠️ Hot Climate Installers: Temperature Coefficients Matter
If you're installing in Texas, Florida, Arizona, or the Southwest, the temperature coefficient of your panel selection directly impacts annual revenue. An N-type TOPCon panel with a −0.29%/°C coefficient will produce measurably more energy over a year than a P-type PERC panel at −0.38%/°C — even though both may carry similar wattage ratings at STC. Run PVsyst or equivalent modeling with real local temperature data before finalizing your panel spec. Our engineering team can help you compare the production models side by side.
Smart system design is the difference between a solar installation that merely works and one that truly performs. The gap between an average installation and an optimized one can be 10–25% in annual energy production — translating directly to faster payback and better lifetime ROI. Here is what we recommend to every contractor and installer who sources from PES Supply.
Installation Best Practices
Optimize orientation and tilt: South-facing (Northern Hemisphere) with a tilt angle matching your latitude delivers the highest annual yield. West-facing arrays can capture more late-afternoon production, which may be more valuable in markets with time-of-use rate structures where evening electricity costs more.
Eliminate shading: Even partial shading on one cell can dramatically reduce output for an entire string. Conduct a thorough shade analysis using tools like the Solmetric SunEye or satellite-based shading reports before finalizing panel layout. Consider microinverters or power optimizers for shading-prone sites.
Select the right inverter: We carry Enphase microinverters, Fronius string inverters, GoodWe, and more. Microinverters are ideal for shading-prone sites and complex roof geometries; string inverters suit unobstructed commercial roofs and ground-mounts where cost efficiency is paramount.
Ensure ventilation: Mount panels with adequate clearance above the roof surface (minimum 3–4 inches) to allow airflow and reduce heat buildup. This is especially critical in hot climates where thermal losses can eat 8–14% of rated output on summer afternoons.
Use quality racking and wiring: Undersized or corroded wiring introduces resistive losses that silently reduce system output every hour of every day. We supply the full balance-of-system components you need — from racking and mounting hardware to conduit, connectors, and monitoring equipment.
Ongoing Maintenance for Sustained Performance
Clean panels periodically — dust, pollen, and bird droppings can reduce output by 5–15%. In dusty or agricultural environments, quarterly cleaning may be necessary. In most residential settings, seasonal rain handles much of this naturally.
Inspect wiring connections and racking hardware annually. Loose connections and corroded terminals create resistance and reduce output. Thermal imaging during peak production can identify hot spots before they become failures.
Monitor system performance with inverter-level or panel-level monitoring to catch issues early. A 10% drop in one string's output often indicates a shading issue, a failed optimizer, or a wiring problem that's costing your customer money every day it goes undetected.
Trim vegetation that may have grown into the panel's sun path since installation. Trees grow — what was a shade-free site at installation may have significant shading two or three years later.
💡 Pro Tip: Maintenance Pays for Itself
Regular maintenance can improve power generation by up to 15% and extend the system's productive lifespan by years. For contractors, offering an annual maintenance package creates a recurring revenue stream and keeps you connected to the customer for future referrals, battery add-ons, and system expansions. Contact our team to learn about bundling maintenance components with your initial equipment orders.
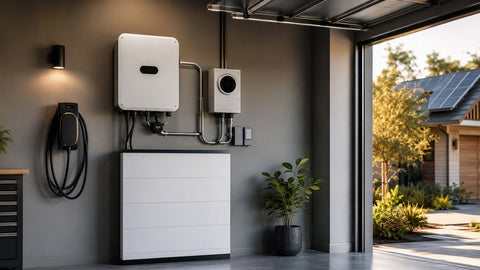
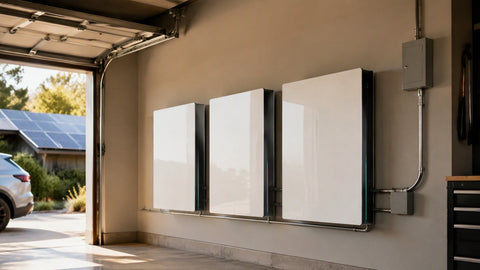
Solar panels only produce electricity while the sun is shining — but energy demand doesn't stop at sunset. Pairing your system with battery storage lets you capture peak-hour production and use it at night, during grid outages, or when utility rates are highest. For homeowners, this means true energy independence. For commercial operators, it means demand charge reduction and backup power. PES Supply stocks a full range of energy storage solutions.
| Battery Type | Typical Cost | Lifespan | Charge Speed | Best For |
|---|---|---|---|---|
| Lithium-Ion (LFP) | Moderate–High | 10–15 years | Fast | Residential & commercial — best all-around performance, longest cycle life |
| Lead-Acid (AGM) | Low | 3–5 years | Slow | Budget-conscious backup power and off-grid cabin systems |
| Flow Batteries | High | 15–20+ years | Moderate | Large-scale utility and commercial storage requiring deep cycling |
Grid-Tied vs. Off-Grid vs. Hybrid
For most residential and commercial projects, a grid-tied system with optional battery backup offers the best balance of cost, reliability, and energy savings. Net metering programs in many states let you earn credits for surplus production sent back to the grid during peak hours, effectively using the utility as a "virtual battery." For customers seeking full independence or operating in areas with unreliable grid service, off-grid and hybrid configurations with dedicated battery banks provide autonomy. Our team can help you determine the right configuration for your project's goals and local utility regulations.
⚠️ 2026 Federal Incentive Alert
The residential 30% federal solar tax credit (Section 25D) expired at the end of 2025 under the One Big Beautiful Bill Act. However, third-party-owned systems (leases, PPAs, prepaid products) installed through the end of 2027 can still qualify for Section 48E credits — including bonuses for domestic content. Strict FEOC (Foreign Entity of Concern) sourcing rules now apply. Consult your tax advisor and ask your installer about eligible panel and battery supply chains before committing.
The solar industry continues to push efficiency and output higher every year. The panels available today produce substantially more power per hour than models from just three to five years ago — and the trajectory is accelerating. Here is what our team is watching — and stocking — for the near future.
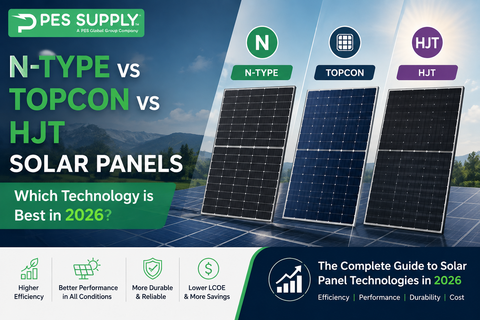
N-type TOPCon cells are now the industry standard in premium modules from Jinko, Trina, and LONGi. These cells deliver 23–25% efficiency and better temperature performance than older P-type PERC technology, meaning more watts per hour in real-world conditions — especially in warm climates. Learn more in our complete guide: N-Type vs. P-Type Solar Panels: The Complete 2026 Guide.
Bifacial modules capture reflected light from the ground surface beneath the array, adding 10–25% additional energy yield depending on the mounting surface and height. For ground-mount commercial and utility projects, bifacial N-type panels are rapidly becoming the default specification.
Higher wattage panels continue to push boundaries. We already stock 580W+ commercial modules, and residential panels are pushing past 430W. Higher wattage per panel means fewer panels, less racking, less labor, and more power per hour from the same roof or ground area.
Perovskite-silicon tandem cells are the next frontier, with lab efficiencies already surpassing 33% — well beyond the ~29.4% theoretical maximum of single-junction silicon. Commercial tandem modules are expected to reach market scale in 2027–2029 and will be built on N-type silicon foundations. Portlandia Electric is tracking these developments and will bring them to market as they become commercially viable.
🔭 Expert Insight: The Efficiency Trajectory
"Five years ago, a 'high-efficiency' residential panel produced 350W. Today, 400–430W is standard, and 580W+ is available for commercial applications. Within three to five years, perovskite tandems could push module-level efficiency past 30%, meaning a single residential panel could produce over 500W per hour of peak sunlight. The question isn't whether to go solar — it's whether to install today's excellent technology now or wait for technology that may still be years from commercial availability."
Understanding how much power solar panels generate per hour is the foundation of every smart solar decision — whether you're a contractor sizing a system, a homeowner evaluating proposals, or a developer modeling project economics. Today's Tier 1 panels from manufacturers like Jinko, Trina, LONGi, Canadian Solar, and REC deliver 370–580+ watts per hour of peak sunlight, with real-world daily production ranging from 1,600 to 2,900+ watt-hours per panel depending on your location and conditions. Pair that with proper installation design, the right inverter, and energy storage, and you have a system that delivers predictable, bankable energy production for 25–35 years.
The Bottom Line
"Every hour of sunlight is an opportunity to generate clean, free electricity — and the difference between a good solar installation and a great one comes down to panel selection, system design, and the quality of components behind them. At PES Supply, we stock the panels, inverters, batteries, racking, and expertise to help you maximize every watt, every hour, every day."
Related Products


CW Energy 410W Solar Panel 108 Cells Bifacial CWT410-108PMB10 Assembled in the USA Wholesale 35 panels per pallet
ViewReady to Build Your Next Solar Project?
PES Supply is your single source for Tier 1 solar panels, inverters, batteries, racking, and full balance-of-system components — with nationwide shipping and dedicated technical support. Ask about our PowerLink Program for contractor lead generation and preferred pricing.
Request a Quote Shop Solar PanelsHow much power does one solar panel produce per hour?
A typical Tier 1 residential solar panel produces 370–420 watts per hour under peak sunlight conditions (1,000 W/m² irradiance at 25°C). Commercial and bifacial panels can produce 450–600+ watts per hour. The exact amount depends on the panel's wattage rating, sunlight intensity, temperature, orientation, and shading conditions at that specific moment.
What is the difference between watts and watt-hours for solar panels?
Watts (W) measure instantaneous power — how much electricity a panel produces at a specific moment. Watt-hours (Wh) measure total energy produced over time. A 400W panel operating at full output for one hour generates 400 Wh. Over 5 peak sun hours, it produces 2,000 Wh (2 kWh). Your electricity bill is measured in kWh, so watt-hours are what ultimately determine your savings and return on investment.
How many peak sun hours does my location get?
Peak sun hours vary significantly by location. The U.S. Southwest (Arizona, Nevada, New Mexico) averages 6–7+ peak sun hours per day. The Southeast and Midwest average 4.5–5.5 hours. The Pacific Northwest and Northeast average 3.5–4.5 hours. These are annual averages — summer months deliver more, winter months less. Use NREL's PVWatts Calculator for precise data for your zip code, or contact our team at PES Supply for help with your production estimates.
Do solar panels produce electricity on cloudy days?
Yes. Solar panels produce electricity from any available light, not just direct sunlight. On days with light or scattered clouds, panels typically produce 60–80% of their clear-sky output. Under heavy overcast, output drops to 15–35%. Even during rain, panels produce 5–20% of rated output. Panels never fully stop generating during daylight hours — and rain has the added benefit of cleaning the panel surface, often improving the next day's production.
How much does temperature affect solar panel output?
Most solar panels lose 0.3–0.5% of output per degree Celsius above 25°C (77°F). On a hot day when panel cell temperatures reach 60°C, a typical P-type panel may lose 12–14% of its rated output. Newer N-type TOPCon and HJT panels have better temperature coefficients (−0.24% to −0.32%/°C), losing only 8–11% under the same conditions. Proper racking with airflow clearance beneath the panels helps reduce thermal losses in any climate.
How can I maximize my solar panel's hourly output?
Five key strategies: (1) Optimize orientation and tilt — south-facing at your latitude angle captures the most sunlight. (2) Eliminate shading — even partial shade on one cell can reduce an entire string's output. (3) Select the right inverter — microinverters for shaded or complex roofs, string inverters for unobstructed installations. (4) Ensure adequate ventilation beneath the panels to reduce heat buildup. (5) Maintain panels regularly — cleaning, wiring inspections, and vegetation trimming can improve output by up to 15%. PES Supply carries all the components needed for an optimized installation.
Should I add battery storage to my solar system?
Battery storage makes sense if you want backup power during outages, if your utility has time-of-use rates where evening electricity is expensive, or if you want to maximize self-consumption of your solar energy. Lithium iron phosphate (LFP) batteries offer the best combination of lifespan (10–15 years), charge speed, and cycle endurance for most residential and commercial applications. For grid-tied systems with favorable net metering, the grid can serve as a virtual battery, making standalone storage less immediately critical — though policies vary by state and utility.
How many solar panels do I need for my home?
The average U.S. home uses approximately 30 kWh per day (around 900 kWh per month). With 400W panels and 5 peak sun hours, each panel produces about 2 kWh per day. To fully offset a 30 kWh/day usage, you would need approximately 15–20 panels (accounting for system losses, inverter efficiency, and degradation). Your actual number will vary based on your electricity consumption, roof orientation, local sun hours, and whether you plan to add an EV charger or heat pump. Our team at PES Supply can help you size the system accurately.
Related Articles
About PES Supply
PES Supply is a nationwide electrical supply distributor offering premium Tier 1 solar panels, standby generators, inverters, and related electrical equipment. With a catalog of 50,000+ SKUs across 169 authorized brands and nationwide LTL freight delivery from our Louisville, Kentucky supply house, we deliver turnkey power solutions with live support and fast nationwide delivery.
📍 Location: 1507 Portland Ave, Louisville, KY, United States 📞 Phone: +1 888-876-0007 🌐 Website: www.portlandiaelectric.supply
Article: How Much Power Do Solar Panels Generate Per Hour? — The Ultimate 2026 Guide
Category: Solar Technology / Energy Production
Last Updated: February 2026
Disclaimer: Power output figures in this guide are estimates based on standard test conditions and typical real-world performance. Actual results vary based on geographic location, weather, system design, equipment selection, and installation quality. Consult with a qualified solar professional and refer to manufacturer datasheets for project-specific calculations. PES Supply provides equipment and technical support — we recommend working with a licensed installer for system design and permitting.
Related Resources:
- Best Solar Panels 2026 — Buyer's Guide
- EG4 vs Tesla Powerwall
- Qcells vs Trina vs JA
- Solar Inverter Buyer's Guide
- Solar Battery Buyer's Guide
- 5kW Solar Kit
- 10kW Solar + Battery Kit
- Off-Grid Cabin Kit
- EG4 Batteries
- Qcells Solar Panels
- Trina Solar
- JA Solar
- REC Solar
- Mission Solar
- Sol-Ark Inverters
- SolarEdge Inverters
- Generac PWRcell
Calculate how much storage you need with our battery sizing calculator.
Check solar incentives available in your state.
Use our free solar system calculator to size your array.
Check out our Solar Panel Comparison Tool. Check out our Inverter Sizing Calculator.
Calculate your solar payback and 25-year savings with our Solar ROI Calculator. Follow our complete DIY solar installation guide for step-by-step instructions. Keep your system running at peak performance with our Solar Maintenance Guide.
Related Resources
- Solar System Calculator
- Battery Sizing Calculator
- Solar Panel Comparison Tool
- Inverter Sizing Calculator
- Solar ROI Calculator
- Solar Installation Guide
- Solar Maintenance Guide
- Solar Permitting Guide
- Battery Installation Guide
- NEC Code Compliance Guide
- Solar Panel Mounting Guide
- Grounding & Bonding Guide
- Solar Incentives by State
- Pro Account — Wholesale Pricing
- PowerLink Network — Contractor Program
How long do solar batteries last?
Most lithium-ion solar batteries last 10-15 years or 6,000+ cycles. The 20-80% charging rule extends battery life significantly.
What size battery do I need?
Battery sizing depends on your backup power needs. A typical home needs 10-15kWh of storage for overnight backup. Calculate your critical loads first.
Are batteries BABA-compliant?
PES Supply provides BABA documentation for qualifying products. Contact us for specific compliance documentation.
PES Supply carries a catalog of 50,000+ SKUs from 169 authorized brands. One PO, one invoice, every trade covered.
Need help sizing? Our team can calculate loads, select equipment, and source everything from one PO.
Call (502) 790-0600
From Nameplate Watts to Real Hourly Kilowatt-Hours
Every conversation about hourly solar production starts with the same unit confusion: watts are power, kilowatt-hours are energy. A panel does not make "400 watts per hour." It makes 400 watts at a given instant under Standard Test Conditions, and if it sustains that output for one full hour it has delivered 0.4 kWh. The distinction sounds academic until you size a battery bank or read a monitoring app, and then it becomes the whole ballgame.
I've walked more than a few customers through this on the phone after they watched their inverter display bounce between 6.8 kW and 7.4 kW on a 10 kW array and assumed something was broken. Nothing was broken. The array was doing exactly what physics says it should do at 2 p.m. on a warm July afternoon with a light film of pollen on the glass. Once we pulled up the irradiance data for their zip code and applied a realistic derate, the numbers lined up within a couple of percent.
The Hourly Production Curve, Hour by Hour
Output follows the sun's arc, and the shape of that arc is remarkably consistent for a fixed-tilt array. On a clear equinox day, a south-facing array at 30-degree tilt produces roughly 10 to 15 percent of its daily energy before 9 a.m., 55 to 65 percent between 9 a.m. and 3 p.m., and the balance in the late afternoon shoulder. The single best hour, usually solar noon plus or minus one hour, carries about 14 to 18 percent of the day's total.
| Clock Hour (PDT) | Instantaneous Power (kW) | Energy That Hour (kWh) | Share of Daily Total | Cumulative Daily Share |
|---|---|---|---|---|
| 7:00–8:00 | 1.1 | 1.1 | 2.4% | 2.4% |
| 8:00–9:00 | 3.4 | 3.4 | 7.3% | 9.7% |
| 9:00–10:00 | 5.6 | 5.6 | 12.1% | 21.8% |
| 10:00–11:00 | 6.9 | 6.9 | 14.9% | 36.7% |
| 11:00–12:00 | 7.6 | 7.6 | 16.4% | 53.1% |
| 12:00–13:00 | 7.9 | 7.9 | 17.1% | 70.2% |
| 13:00–14:00 | 7.3 | 7.3 | 15.8% | 86.0% |
| 14:00–15:00 | 5.0 | 5.0 | 10.8% | 96.8% |
| 15:00–16:00 | 1.5 | 1.5 | 3.2% | 100.0% |
| Total | — | 46.3 | 100% | — |
The table above models a clear-day production curve for a 10 kW array in a 5.8 peak-sun-hour climate at 80 percent system derate: 10 kW × 5.8 hours × 0.80 = 46.4 kWh, matching the 46.3 kWh column total within rounding. Notice that the noon hour alone delivers 7.9 kWh — that is the honest answer to "how much power per hour" for a well-sited residential array.
Wiring the Array for the Power It Actually Makes
Hourly production math feeds directly into conductor sizing, and this is where NEC Article 690 takes over from the marketing brochures. Under NEC 690.8, circuit currents are calculated at 125 percent of module short-circuit current before any additional correction, and conductors must carry 125 percent of that value again for continuous operation — a combined 1.56 multiplier on Isc. A string of modern 430 W modules with an Isc of 13.9 A therefore needs conductors rated for at least 21.7 A before temperature corrections, which lands you on 10 AWG copper at 75°C termination limits with room to spare.
| Copper Conductor (THHN/THWN-2) | Ampacity at 75°C (NEC 310.16) | Max Continuous PV Current (÷1.25) | Max Module Isc It Supports (÷1.56) | Typical Use |
|---|---|---|---|---|
| 14 AWG | 20 A | 16.0 A | 12.8 A | Older low-current strings only |
| 12 AWG | 25 A | 20.0 A | 16.0 A | Single residential string |
| 10 AWG | 35 A | 28.0 A | 22.4 A | High-current residential string |
| 8 AWG | 50 A | 40.0 A | 32.1 A | Two paralleled strings |
| 6 AWG | 65 A | 52.0 A | 41.7 A | Small commercial combiner output |
| 4 AWG | 85 A | 68.0 A | 54.5 A | Commercial combiner feeder |
We spec 10 AWG PV wire on nearly every residential string we build now, even when 12 AWG would pass inspection, because the voltage-drop margin pays for itself on long roof-to-inverter runs. My crew measured a 1.8 percent voltage drop on a 90-foot 12 AWG run last spring; swapping to 10 AWG on the next job cut that to 1.1 percent, which is real energy over a 25-year life.
Overcurrent Protection and Standard Breaker Sizes
Once you know the continuous current, NEC 240.6(A) defines the standard overcurrent device ratings you are allowed to reach for. The next-size-up rule in 240.4(B) permits rounding to the next standard rating when the conductor ampacity does not land exactly on a listed size, as long as the load is continuous and under 800 A and the next size does not exceed the conductor's protected capacity in context.
| Calculated Continuous Current | Required Ampacity (×1.25) | Conductor Choice (75°C) | Standard OCPD (NEC 240.6) |
|---|---|---|---|
| 13.9 A (one string) | 17.4 A | 12 AWG (25 A) | 20 A |
| 27.8 A (two strings) | 34.8 A | 8 AWG (50 A) | 40 A |
| 41.7 A (three strings) | 52.1 A | 6 AWG (65 A) | 60 A |
| 55.6 A (four strings) | 69.5 A | 4 AWG (85 A) | 80 A |
| 69.5 A (five strings) | 86.9 A | 3 AWG (100 A) | 100 A |
I quoted a retrofit last fall where the original installer had fused a three-string array at 30 A on 10 AWG wire. The math says 41.7 A continuous needs a 60 A breaker on 6 AWG. We pulled new conductors, swapped the disconnect, and the nuisance tripping that had plagued the customer every June disappeared. That is what the code tables look like in the real world: fewer truck rolls.
Seasonal Reality: What an Hour of Sun Delivers Across the Year
Annual averages hide the seasonal swing that dominates hourly output. A fixed-tilt array in the Pacific Northwest might see 1.5 peak sun hours in December and 6.5 in July — a 4.3× swing in the energy each daylight hour carries. The same array in Phoenix swings from about 4.5 to 7.5. If you are planning hourly loads against hourly production, plan against the winter month, not the annual mean, or add storage to bridge the gap.
| Region | Dec Peak Sun Hours | Jul Peak Sun Hours | 10 kW Daily kWh, Dec (×0.80) | 10 kW Daily kWh, Jul (×0.80) |
|---|---|---|---|---|
| Portland, OR | 1.5 | 6.5 | 12.0 | 52.0 |
| Denver, CO | 3.5 | 6.8 | 28.0 | 54.4 |
| Kansas City, MO | 2.8 | 6.2 | 22.4 | 49.6 |
| Atlanta, GA | 3.2 | 5.9 | 25.6 | 47.2 |
| Phoenix, AZ | 4.5 | 7.5 | 36.0 | 60.0 |
Our shop is in Portland, so we live the top row of that table. I tell every customer the same thing: a 10 kW array here is a 52 kWh-per-day machine in July and a 12 kWh-per-day machine in December. Both numbers are true, and the annual production estimate is only the average of those two realities.
Putting It Together: A Worked Hourly Example
Take a single 430 W module in Denver in July. Peak sun hours: 6.8. Daily energy after an 0.80 derate: 0.43 kW × 6.8 × 0.80 = 2.34 kWh. Spread across the production curve, the noon hour carries about 17 percent of the day, or 0.40 kWh — essentially the panel's nameplate wattage expressed as one hour of energy. In December that same noon hour delivers closer to 0.21 kWh. Same panel, same roof, half the energy per hour, because the sun sits lower, the days run shorter, and snow sometimes wins.
If you are sizing an array from a monthly bill, work the problem backward: divide the monthly kWh target by 30, then by your local peak sun hours, then by 0.80, and you have the array kW you need. For 1,200 kWh per month in Kansas City: 1,200 ÷ 30 = 40 kWh per day; 40 ÷ 6.2 = 6.45 kW; 6.45 ÷ 0.80 = 8.1 kW, or nineteen 430 W modules. Check that against your December row if winter self-sufficiency matters to you.
Keep Digging: Related Guides and Tools
If this hourly math has you thinking about system size, our solar system size calculator walkthrough turns a utility bill into an array size in about five minutes. Pair it with the solar ROI calculator to see what those kilowatt-hours are worth at your utility rate. For the wiring side of the conversation, the NEC wire sizing guide expands the ampacity tables above, and the panel wiring basics article covers series-versus-parallel decisions. Shopping for modules? Browse current inventory in our 430 W solar panels and 450 W solar panels collections, or start from a complete solar panel kit buyer's guide. If you are weighing storage to shift those noon-hour kilowatt-hours into the evening, the battery sizing calculator and the energy storage primer are the right next reads.
Frequently Asked Questions
How many kWh does a solar panel produce per hour?
A single residential panel rated at 400 to 450 watts produces roughly 0.4 kWh during one peak-sun hour under lab conditions, and about 0.28 to 0.36 kWh in a real-world hour after temperature, soiling, and inverter losses. Over a full day, that same panel typically yields 1.6 to 2.4 kWh depending on your region's peak sun hours.
What is a peak sun hour?
A peak sun hour is one hour of sunlight averaging 1,000 watts per square meter, which is the irradiance level used to rate panels at Standard Test Conditions. Most of the continental United States receives between 3.5 and 6.5 peak sun hours per day on an annual average.
Why does my panel produce less than its nameplate rating?
Nameplate wattage is measured at 25 degrees Celsius cell temperature with 1,000 W/m2 irradiance. Roof-mounted cells routinely run 20 to 35 degrees hotter than ambient, and every degree above 25 costs roughly 0.35 to 0.45 percent of output for a typical mono PERC module. Add soiling, wiring, and inverter losses and a system derate of 14 to 22 percent is normal.
How do I calculate hourly solar production for my array?
Multiply array size in kW by the peak sun hours for your location, then multiply by a system derate factor near 0.80. A 10 kW array in a 5.0 peak-sun-hour region produces about 40 kWh per day, with the noon hour often contributing 6.5 to 8 kWh of that total.
Does panel wattage change how much power I get per hour?
Yes, proportionally. Moving from a 400 W panel to a 450 W panel raises hourly energy by about 12.5 percent at the same irradiance, because 450 divided by 400 equals 1.125. Efficiency matters most when roof space is the binding constraint.
How many solar panels do I need to cover 1,000 kWh per month?
In a region averaging 4.5 peak sun hours, one 430 W panel makes about 1.55 kWh per day or 46.5 kWh per month after derate. Dividing 1,000 by 46.5 gives about 22 panels, which is a 9.5 kW array. High-sun Southwest sites need closer to 16 panels for the same energy.