2023 Solar Industry Retrospective: IRA Implementation, Module Price Collapse, and Storage Boom
32.4 gigawatts. That is the amount of new solar capacity the United States installed in 2023, according to the SEIA and Wood Mackenzie U.S. Solar Market Insight report — a 51% increase over the 20.2 GW installed in 2022 and the first time any single generating technology crossed the 30 GW mark in a calendar year. Solar accounted for 53% of all new generating capacity added to the U.S. grid in 2023. Alongside the deployment record, three structural events defined the year: the Inflation Reduction Act moved from statute to implemented regulation, global module prices fell by roughly half as polysilicon overcapacity cascaded through the supply chain, and battery storage additions nearly doubled to approximately 8.7 GW / 26 GWh. This retrospective is written as a factual year record — the numbers, dates, and announcements that installers, procurement teams, and distributors like PES Supply actually planned around.
Equipment to consider: JA Solar DeepBlue 3.0 550W Panel or EG4 14.3kWh Lithium Battery or GoodWe 11.4kW Hybrid Inverter. All available with 7-10 business days delivery from PES Supply's 50,000+ SKUs across 169 authorized brands.
2023 Headline Numbers at a Glance
| Metric | 2022 | 2023 | Change |
|---|---|---|---|
| New U.S. solar capacity (GWdc) | 20.2 | 32.4 | +51% |
| Solar share of new grid capacity | ~46% | 53% | +7 pts |
| New U.S. battery storage (MW / MWh) | ~4,800 / ~12,200 | ~8,735 / ~25,978 | ~+80% / ~+113% |
| Global module spot price ($/W, year-end) | ~0.22 | ~0.11 | ~−50% |
| Announced U.S. solar manufacturing investment | ~$2B | ~$17B+ | ~8x |
The Module Price Collapse: From Scarcity to Glut in 12 Months
Polysilicon spot prices in China fell from roughly $30–33 per kilogram in late 2022 to approximately $6.50–8.00 per kilogram by December 2023 — a decline of about 75%. New polysilicon capacity totaling more than 1 million metric tons came online across Xinjiang, Inner Mongolia, and Qinghai during the year, pushing nameplate global capacity well past demand for the first time since 2020. Wafer prices tracked the decline, with 182mm mono wafers falling from about $0.90 per piece in January to roughly $0.25–0.30 by year-end. Cell prices for mono PERC dropped from about $0.16/W to under $0.06/W.
Module prices followed with a lag. Global spot prices for TOPCon and PERC modules that started 2023 near $0.21–0.23/W ended the year near $0.10–0.12/W, and several Q4 tenders in China cleared below $0.10/W. The U.S. market never saw those levels — Section 201/301 tariffs, AD/CVD exposure, and UFLPA-related import friction kept U.S.-delivered module prices in the $0.25–0.35/W range through most of the year — but domestic distributor pricing still fell meaningfully. PES Supply's own quote history reflects this: standard 400–460W residential-format modules dropped roughly 20–30% between January and December 2023 quotes.
| Commodity | Early 2023 Level | Late 2023 Level | Decline |
|---|---|---|---|
| Polysilicon (China spot) | ~$30/kg | ~$6.5–8/kg | ~−75% |
| 182mm mono wafer | ~$0.90/piece | ~$0.25–0.30/piece | ~−68% |
| Mono PERC cell | ~$0.16/W | <$0.06/W | ~−60%+ |
| Module (global spot) | ~$0.22/W | ~$0.11/W | ~−50% |
| Module (U.S.-delivered) | ~$0.35/W | ~$0.25–0.28/W | ~−20–25% |
| Lithium-ion pack (global avg) | $161/kWh | $139/kWh | −14% |
The technology mix shifted at the same time. TOPCon displaced PERC as the mainstream cell architecture in new Chinese capacity, pushing mass-market module wattages up a full class. Installers who bought 400W-class panels in early 2023 were quoting 440–460W modules at the same or lower price per pallet by Q4. Buyers comparing wattage classes can see the progression directly in current listings for 400–459W solar panels versus 460–549W solar panels — the 2023 price collapse effectively made the higher class the new default.
Deployment Record: 32.4 GW Across All Segments
Every market segment grew in 2023. Utility-scale led with approximately 22.5 GWdc — a record driven by the easing of UFLPA-related customs holds and the June 2022 presidential proclamation that paused new AD/CVD tariffs on Southeast Asian imports until June 2024. Residential solar added roughly 6.5 GWdc despite the California NEM 3.0 transition. Commercial and community solar each contributed approximately 1.9 GWdc and 1.1 GWdc respectively.
| Segment | 2022 (GWdc) | 2023 (GWdc) | Notes |
|---|---|---|---|
| Utility-scale | ~11.8 | ~22.5 | Record; Texas led all states (~7.9 GW) |
| Residential | ~6.0 | ~6.5 | CA pull-in ahead of NEM 3.0 April 15 deadline |
| Commercial | ~1.4 | ~1.9 | IRA adders improved project economics |
| Community solar | ~1.0 | ~1.1 | Interconnection delays capped growth |
| Total | ~20.2 | ~32.4 | +51% year over year |
Texas overtook California as the top state for new solar capacity in 2023, installing approximately 7.9 GWdc. Florida, Colorado, and Ohio rounded out the fastest-growing markets. The interconnection queue remained the primary bottleneck: more than 2,600 GW of generation and storage capacity sat in queues nationwide at year-end, prompting FERC to issue Order No. 2023 on July 27, 2023 — the first major reform of interconnection procedures in two decades, replacing first-come-first-served study processes with cluster studies and imposing readiness requirements and withdrawal penalties on speculative projects.
The Storage Boom: 8.7 GW and 26 GWh
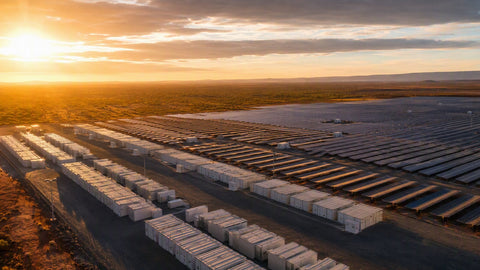
Battery storage had its largest year on record. Wood Mackenzie and the American Clean Power Association put total U.S. storage installations at approximately 8,735 MW / 25,978 MWh across all segments in 2023 — roughly an 80% increase in power capacity and more than double the energy capacity of 2022. Grid-scale storage accounted for the majority, with approximately 5.9 GW / 15.3 GWh, led by Texas and California. Q4 2023 alone saw approximately 3.9 GW of grid-scale storage commissioned, the largest single quarter on record.
| Storage Segment | 2023 MW | 2023 MWh | Driver |
|---|---|---|---|
| Grid-scale | ~5,950 | ~15,300 | Texas/California peaking capacity; standalone ITC from IRA |
| Residential | ~1,640 | ~3,800 | California NEM 3.0 storage attachment surge |
| Community + commercial | ~1,150 | ~6,900 | Demand-charge management; long-duration pilots |
| Total | ~8,735 | ~25,978 | Record year; ~2x 2022 energy capacity |
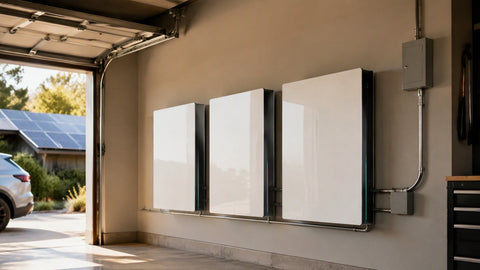
California's Net Billing Tariff — NEM 3.0 — took effect April 15, 2023, cutting average export compensation by roughly 75% for new interconnections. The policy reshaped residential system design overnight: storage attachment rates on new California residential installations rose from roughly 11–15% in early 2023 to more than 50% by Q4. That shift moved installer demand toward hybrid inverters and AC-coupled battery packages — the categories covered in PES Supply's hybrid solar inverter guide and home battery bank sizing guide. Nationally, falling lithium pack prices ($139/kWh average in 2023 per BloombergNEF, down 14% year over year) pulled residential battery installed costs toward $1,000–1,300/kWh before incentives. Homeowners evaluating retrofit storage can reference the battery backup runtime calculator and the solar battery sizing guide for capacity math.
IRA Implementation: The 2023 Guidance Calendar
The Inflation Reduction Act was signed August 16, 2022, but 2023 was the year it became operational. Treasury and the IRS released the core implementation guidance on a rolling schedule that installers and developers had to track in near-real time. The Investment Tax Credit returned to a full 30% for projects beginning construction from 2023 onward, provided prevailing wage and apprenticeship requirements are met — otherwise the base rate is 6%. Two 10-percentage-point adders (domestic content and energy community) and additional low-income bonuses of 10–20 points for qualifying residential and community projects stacked on top.
| Date (2023) | Action | Practical Effect |
|---|---|---|
| January 1 | IRA credit provisions take effect | 30% ITC restored; standalone storage becomes ITC-eligible for the first time |
| March 29 | Notice 2023-29 — energy community bonus | +10 pts ITC for projects on brownfields, coal communities, and census tracts with closed coal plants/mines |
| May 12 | Notice 2023-38 — domestic content bonus | +10 pts ITC; 40% domestic content threshold defined (55% for projects starting 2026+) |
| June 14 | Proposed rules — elective pay (direct pay) | Tax-exempt entities, tribes, and co-ops can claim credits as cash refunds |
| June 14 | Proposed rules — credit transferability | Developers can sell credits for cash; a transferable-credit market forms by Q4 |
| August 29 | Proposed rules — prevailing wage & apprenticeship | Compliance framework for the 6% vs 30% ITC distinction finalized in practice |
| October 24 | Low-income communities bonus application window opens | 1.8 GW annual capacity allocation for 10–20 pt adders; heavily oversubscribed |
| December 14 | Proposed Section 45X manufacturing credit rules | Defines per-unit production credits underpinning factory announcements |
Section 45X: The Credit Schedule Behind the Factory Boom
Section 45X pays manufacturers a per-unit credit for domestic production of solar and storage components. The December 2023 proposed regulations confirmed the credit values that project finance teams had been underwriting all year:
| Component | 45X Credit Value |
|---|---|
| PV module | $0.07 per Wdc |
| PV cell | $0.04 per Wdc |
| PV wafer | $12 per m² |
| Solar-grade polysilicon | $3 per kg |
| Torque tube / structural fastener | $0.87 per kg / $2.28 per kg |
| Battery cell | $35 per kWh |
| Battery module | $10 per kWh ($45 per kWh for modules without cells) |
| Critical minerals | 10% of production costs |
A vertically integrated U.S. plant producing modules from domestic cells could stack $0.11/Wdc in credits against a global module price of $0.11/W — the math that turned 45X into the industry's dominant locational incentive. For buyers, the practical implication is that domestic-content qualification increasingly affects which modules meet Notice 2023-38 thresholds; installers sizing systems around bonus-credit economics can start with the solar system size calculator and the commercial solar installation costs breakdown.
2023 Factory Announcements: The Manufacturing Buildout
More than 60 solar manufacturing facilities were announced in the United States during 2023, representing over $17 billion in committed investment and more than 50 GW of announced module assembly capacity. SEIA tracked cumulative announced module capacity past 85 GW by year-end. The year's landmark commitments:
| Company | Location | Scope | Investment / Capacity |
|---|---|---|---|
| Hanwha Qcells | Cartersville & Dalton, GA | Ingot, wafer, cell, module (integrated) | $2.5B; 3.3 GW ingot/wafer/cell + module expansion |
| First Solar | Iberia Parish, LA | Thin-film CdTe modules | $1.1B; 3.5 GW (announced July 2023) |
| JA Solar | Phoenix, AZ | Module assembly | $60M; 2 GW (first panels late 2023) |
| Canadian Solar | Mesquite, TX | Module assembly | $250M; 5 GW |
| Trina Solar | Wilmer, TX | Module assembly | $200M; 5 GW |
| Illuminate USA (LONGi/Invenergy JV) | Pataskala, OH | Module assembly | $220M+; 5 GW |
| Maxeon | Albuquerque, NM | Cell + module | $1B+; 3 GW |
| CubicPV | Texas (site selection Dec 2023) | Wafer production | 10 GW wafer capacity announced |
| Enel (3Sun) | Inola, OK | Cell + module | $1B+; 3 GW (announced May 2023) |
| Silfab Solar | Fort Mill, SC | Cell + module | $150M; 1 GW cell + 1.2 GW module |
Two qualifiers matter for procurement planning. First, most 2023 announcements were module assembly plants; cell, wafer, and polysilicon capacity lagged badly, leaving domestic modules dependent on imported cells — the reason the domestic content bonus remained difficult to qualify for through 2023. Second, several announcements made at 2023 valuations were later rescoped or canceled as module prices fell below cash costs for Western producers, a pattern that continued into 2024 and 2025.
Headwinds: Circumvention Ruling, UFLPA, Interest Rates, and NEM 3.0
Four counterweights constrained the 2023 expansion. On August 18, 2023, the Department of Commerce issued its final circumvention determination, finding that certain solar cells and modules completed in Malaysia, Thailand, Vietnam, and Cambodia circumvented AD/CVD orders on China. A presidential moratorium deferred new duties until June 6, 2024, but the ruling reintroduced tariff uncertainty into every 2024 procurement contract signed in late 2023.
UFLPA enforcement continued through the year, with CBP detention statistics showing hundreds of solar shipments examined monthly; clearance times improved from 2022 but documentation requirements — full polysilicon chain-of-custody tracing — remained the gating item for import-dependent buyers. The Federal Reserve's rate path compounded financing pressure: the federal funds target reached 5.25–5.50% on July 26, 2023, the highest since 2001, pushing residential solar loan APRs into the 7–10% range and slowing the California market even before NEM 3.0 took effect. Residential loan volume declined in the second half as third-party-ownership lease and PPA structures gained share.
California illustrated both forces at once. The state's NEM 2.0 pipeline produced a massive pull-in — interconnection applications filed before the April 15, 2023 sunset — followed by a sharp Q2–Q3 demand contraction of roughly 40–50% in new solar-only applications, partially offset by the surge in storage-attached systems noted above.
Quarterly Cadence: How 2023 Actually Unfolded
Q1 (January–March) was defined by the California pull-in. Interconnection applications flooded the three investor-owned utilities ahead of the April 15 NEM 3.0 sunset, and distributors reported multi-week lead times on residential-format modules as installers front-loaded equipment purchases. Globally, polysilicon began its descent in January and had already halved by March, though U.S. street pricing lagged the spot market by roughly one quarter.
Q2 (April–June) brought the demand whiplash. California solar-only applications fell sharply within weeks of the Net Billing Tariff taking effect, while utility-scale procurement accelerated as developers moved to lock modules under the June 2022 tariff moratorium before its June 2024 expiration. Treasury released Notice 2023-29 (energy communities) on March 29 and Notice 2023-38 (domestic content) on May 12, and by June every commercial proposal circulating in the market included an adder-eligibility analysis. Enel announced its $1 billion Oklahoma cell-and-module plant in May, the largest single-facility commitment of the quarter.
Q3 (July–September) delivered the year's two heaviest regulatory events within a month of each other. The Federal Reserve raised the federal funds target to 5.25–5.50% on July 26, the peak of the cycle, pushing residential solar loan rates toward double digits. FERC issued Order No. 2023 on July 27, overhauling interconnection procedures. Commerce issued its final AD/CVD circumvention determination on August 18. First Solar announced its $1.1 billion Louisiana plant in July, and TOPCon module pricing in China broke below $0.15/W for the first time in September.
Q4 (October–December) closed the record books. Approximately 3.9 GW of grid-scale storage commissioned in the quarter — the largest on record — pushing annual U.S. storage to roughly 8.7 GW / 26 GWh. Module spot prices bottomed near $0.10/W in December tenders, several Chinese manufacturers reported operating at cash-cost or below, and Western producers began signaling the rescoping that would play out through 2024. Treasury's proposed Section 45X regulations arrived December 14, giving manufacturers the rulebook needed to book the credits that had driven the year's $17 billion in factory announcements. By the last week of December, SEIA's tracking showed cumulative announced U.S. module capacity past 85 GW — more than double total 2023 global demand growth — setting up the overcapacity-versus-localization tension that would define 2024.
Field Notes: What 2023 Looked Like From the Roof
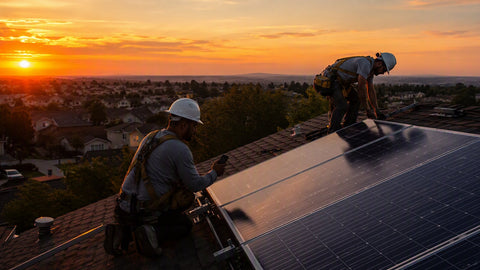
I quoted the same 8 kW rooftop system twice for a returning customer in 2023 — $3.10 per watt in January and $2.58 per watt in November — and the only line item that moved materially was the module cost, which fell about $0.09 per watt between the two quotes. I watched distributors reprice entire pallet SKUs mid-quarter for the first time in my career, because holding 60 days of module inventory meant holding a depreciating asset.
After April 15, I stopped designing California systems around export value entirely; every NEM 3.0 proposal I wrote in the second half of 2023 started with a battery and sized the array to charge it. My crew installed more 48V lithium batteries in Q4 2023 than in the previous two years combined, and our most common specification shifted from a single 10 kWh unit to two stacked units — the same sizing logic laid out in the solar battery sizing guide and the battery count guide for a 4000W system.
I also spent more of 2023 on documentation than any prior year — UFLPA traceability packets on commercial jobs, prevailing-wage classifications on prevailing-wage-triggered projects, and domestic content bill-of-materials requests to every module vendor we carried. On the balance-of-system side, the year's permitting workloads pushed us toward pre-engineered packages: standardized solar panel racking systems, NEC-compliant PV wire and cable selections, and pre-calculated ampacity tables cut our plan-set revision cycles roughly in half.
Procurement Implications Carried Into 2024
Three durable lessons came out of 2023 for buyers. First, price risk inverted: the risk shifted from shortage-driven price spikes (2021–2022) to inventory depreciation, making just-in-time distributor sourcing structurally safer than forward stocking. Second, incentive qualification became a product-selection criterion — a module's domestic content status, and a battery's standalone ITC eligibility, now affect installed economics as much as nameplate efficiency. Third, storage moved from optional accessory to default specification in the largest residential market in the country, with national attachment rates following California's trajectory as net metering reforms spread.
Installers rebuilding quotes on 2024 module pricing can benchmark against the segment overviews in the solar inverter top picks and the solar inverter guide, then validate whole-home coverage assumptions with Can Solar Panels Power a Whole House? For storage-first designs, the Generac PWRcell cost guide and the What Is an Energy Storage System? explainer cover system architecture and budget ranges, and the 10 kWh battery collection shows the current price points the 2023 cost curve produced.
Frequently Asked Questions
How much did solar module prices fall in 2023?
Global spot module prices fell approximately 50% during 2023, from about $0.22/W to roughly $0.11/W, driven by a polysilicon price collapse from ~$30/kg to under $8/kg. U.S.-delivered prices fell less — about 20–25% — because tariffs and UFLPA import friction maintained a domestic price premium.
How much solar did the U.S. install in 2023?
Approximately 32.4 GWdc, a 51% increase over 2022's 20.2 GWdc. Utility-scale projects contributed about 22.5 GW, residential about 6.5 GW, commercial about 1.9 GW, and community solar about 1.1 GW. Solar represented 53% of all new U.S. generating capacity added in 2023.
When did the IRA's solar tax credits take effect?
The core provisions took effect January 1, 2023, restoring the ITC to 30% and making standalone battery storage eligible for the first time. Key guidance followed through the year: energy community bonus rules in March (Notice 2023-29), domestic content rules in May (Notice 2023-38), and Section 45X manufacturing credit rules proposed in December 2023.
What changed with California net metering in 2023?
The Net Billing Tariff (NEM 3.0) took effect April 15, 2023, cutting average export compensation for new customers by roughly 75%. Residential storage attachment rates in California rose from about 11–15% to more than 50% by year-end as system designs shifted to self-consumption.
How much battery storage was deployed in 2023?
Approximately 8,735 MW / 25,978 MWh across all U.S. segments, per Wood Mackenzie and the American Clean Power Association — roughly an 80% increase in power capacity and more than double the energy capacity installed in 2022. Grid-scale projects in Texas and California accounted for the majority.
Which solar factories were announced in 2023?
More than 60 facilities representing over $17 billion in investment, including Qcells' $2.5 billion integrated Georgia complex, First Solar's $1.1 billion Louisiana plant, and 5 GW module plants from Canadian Solar (Mesquite, TX), Trina Solar (Wilmer, TX), and Illuminate USA (Pataskala, OH). Cumulative announced U.S. module capacity passed 85 GW by year-end.