The Crossover Already Happened — Most Businesses Just Haven't Looked
Somewhere in the last decade, while most business owners were busy running their businesses, solar electricity quietly became the cheapest new source of power in most of America. Not the greenest choice that costs more — the cheapest choice, full stop. The gap is not subtle: utility-delivered commercial power in much of the country runs 11 to 24 cents per kilowatt-hour, while electricity from a solar array installed on your own building, after every incentive, lands between 3 and 6 cents. This article lays out the numbers behind that claim — fuel cost volatility, the true structure of your utility bill, the cost stack of a solar installation, and the transition steps — so you can verify the comparison against your own bills rather than taking anyone's word for it.

Fossil Electricity's Real Price: The Bill Behind the Bill
What a business pays for fossil-generated electricity is never just the commodity. A commercial invoice stacks the energy charge on top of demand charges, fuel-cost adjustment clauses, transmission riders, and regulatory pass-throughs — and every one of those lines has a direction it moves over time. Hint: not down. The fuel-cost adjustment line deserves special attention because it is the direct pipeline from global fuel markets into your operating budget. When natural gas spiked in 2022, commercial customers in gas-heavy territories absorbed double-digit percentage increases in a single year, with no vote and no recourse.
| Cost Layer on a Typical Commercial Bill | Share of Total | 20-Year Direction |
|---|---|---|
| Energy (generation) charge | 40–55% | Tracks fuel markets — volatile |
| Demand charges (peak kW) | 25–40% | Rising as grid infrastructure ages |
| Transmission & distribution riders | 10–20% | Steadily rising; grid hardening costs |
| Fuel-cost adjustment clauses | Variable | Spikes passed through within months |
Solar's Price: Fixed, Forecastable, and Falling
Solar's fuel arrives free every morning, which collapses the entire volatile layer of the bill to zero for every kilowatt-hour you self-generate. What remains is a one-time capital cost, and that cost has followed one of the steepest learning curves in industrial history: module prices down roughly 90% since 2010, installed commercial costs down by more than half, and current turnkey pricing at $1.80–$2.40 per watt for commercial scale before incentives. The result, in levelized terms:
| Source | Typical Cost per kWh | Price Behavior Over 25 Years |
|---|---|---|
| Utility commercial retail (gas/coal-heavy mix) | $0.11–$0.24 | Rises ~2.5–3%/yr with spike risk |
| Commercial solar, post-incentive LCOE | $0.032–$0.050 | Fixed at installation — zero escalation |
| Solar + storage (storage cost allocated) | $0.06–$0.09 blended | Fixed; adds demand-charge control |
Read the right-hand column twice — it is the whole argument. A kilowatt-hour of solar bought in 2026 costs the same in 2046. A kilowatt-hour of utility power bought at 14 cents today costs about 29 cents in 2046 at historical escalation. Every year you wait, the comparison gets worse for the fossil option.
A Worked Example: The 20-Year Ledger for a Small Manufacturer
Take a fabrication shop using 150,000 kWh a year at a blended $0.145/kWh — a $21,750 annual electric budget. A 110 kW rooftop array (190 modern 580W modules) produces about 145,000 kWh in year one in a 4.5-sun climate, covering 97% of consumption on an annual basis:
| Line | Stay on Utility | Install 110 kW Solar |
|---|---|---|
| Year-1 electricity cost | $21,750 | ≈ $650 (residual 3%) |
| Capital outlay (net of 30% ITC + MACRS) | $0 | ≈ $95,000–$105,000 |
| Year-10 electricity cost (3% escalation) | ≈ $29,200 | ≈ $870 |
| Year-20 electricity cost | ≈ $39,300 | ≈ $1,170 |
| 20-year cumulative electricity spend | ≈ $584,000 | ≈ $17,600 + net capital |
| 20-year net position | −$584,000 | ≈ −$460,000 total savings |
Simple payback lands inside five years; the internal rate of return over 25 years runs in the high teens. No other capital project available to most small manufacturers combines that return with zero market risk — the savings don't depend on finding a single new customer. Model your own facility with the solar ROI calculator and grade quotes against our commercial installation cost benchmarks.
Volatility Is a Cost Even When Prices Are Flat

CFOs pay for certainty, and fossil electricity offers none. Budget season for a gas-heated, grid-powered business is an annual exercise in guessing fuel markets; budget season for a solar-equipped business is copying last year's number. That predictability has real balance-sheet value: lenders view stable operating costs favorably, multi-year customer contracts can be priced without energy-escalation clauses, and management attention goes to the business instead of the utility docket. I have watched a cold-storage customer renegotiate their bank line partly on the strength of a fixed energy cost structure — the solar array on the roof showed up in a credit conversation, which is not a sentence anyone would have written in 2010.
The Demand-Charge Dimension Fossil Can't Fix
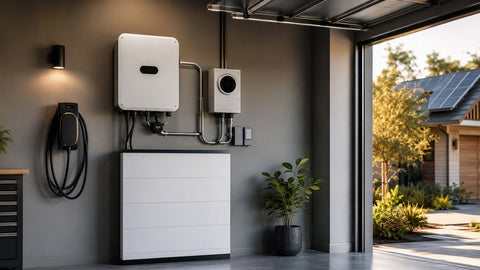
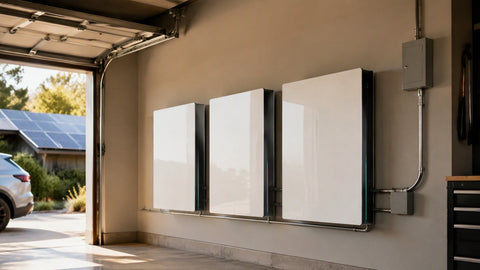
Demand charges — billed on your highest fifteen-minute consumption spike — are the fossil grid's least defensible line item, and solar-plus-storage is the only on-site tool that attacks them directly. A battery dispatched against peak events can cut demand charges 30–50% on the right tariff, savings that layer on top of the energy offset. Even without storage, a solar array that suppresses midday peaks on sunny days trims demand on the days that tend to set monthly peaks — cooling-heavy afternoons. For the storage side of the design, start with the commercial battery collection and our energy storage explainer.
What an Affordable Transition Actually Looks Like
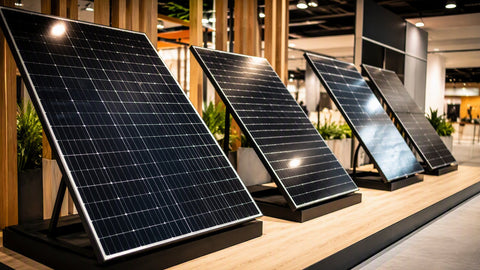
The businesses that capture these economics follow a consistent sequence. First, pull twelve months of interval data and understand your tariff — energy rate, demand rate, riders, escalation history. Second, get three engineering-grade quotes showing DC size, production with stated performance ratio, gross cost per watt, itemized incentives, and 25-year cash flow. Third, structure the capital correctly: cash or loan for taxable owners capturing the ITC and depreciation; PPA or direct-pay structures for nonprofits. Fourth, phase storage in where the tariff justifies it — demand-heavy tariffs first. Fifth, commission monitoring and treat the array as the financial asset it is. Equipment sourcing is the easy half: panels from the commercial panel collection, inverters from commercial inverters, and everything between from the commercial solar catalog.
The Objections, Answered With Arithmetic
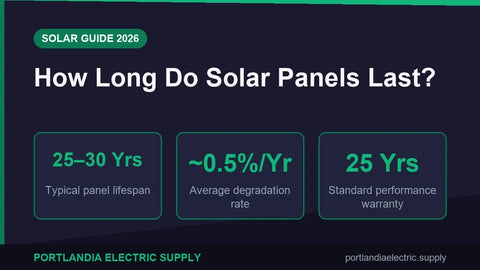
"Solar is intermittent." True — and irrelevant to the cost comparison, because the grid remains your nighttime supplier; you are arbitraging a 14-cent product with a 4-cent product, not seceding from the utility. "The panels will need replacing." Modules carry 25–30-year performance warranties; the asset outlasts most commercial roofs. "Technology will improve, so wait." This objection has been continuously true for fifteen years, and every business that waited paid retail rates the whole time — the correct move is to install at today's price and install again when expansion makes sense. "My roof isn't suitable." Ground mounts and carports solve that; the racking guide covers the options. In my experience the honest objection list is short, and every item on it has a price — the question is whether the price beats the status quo, and in most markets it does by a factor of three.
Fifty Years of Fossil Prices: The Pattern That Matters
Strip away the headlines and fossil electricity pricing follows one durable pattern: a rising baseline punctuated by violent spikes. Oil shocks in the 1970s, gas spikes in 2008 and 2022, coal's regulatory repricing through the 2010s — each event repriced commercial electricity within months, and none of them ever gave the money back. Solar's pattern is the photographic negative: a falling cost curve with zero fuel events, ever. A business choosing between the two is not choosing between two commodities; it is choosing between two statistical distributions — one with fat tails pointed at your budget, one with no tails at all. Risk managers pay premiums to eliminate distributions like the first one. Solar eliminates it for the portion of load you self-supply, at a negative premium.
Three Industries, Three Snapshots

| Industry | Load Profile | Solar Capture | Why It Works |
|---|---|---|---|
| Cold storage / grocery | Flat, refrigeration-heavy, 24/7 | 60–75% of kWh | Daytime solar covers peak compressor load; resilience layer protects inventory |
| Light manufacturing | 1–2 shifts, weekday | 80–95% of kWh | Load curve nearly overlaps the solar curve exactly |
| Office / retail | Daytime-peaking | 70–90% of kWh | Peak hours = sun hours; property-value upside stacks on |
The common thread: commercial loads peak when the sun shines. Residential solar fights an evening-load mismatch that storage must bridge; most commercial solar doesn't even have that problem. It is the best-matched generation-load pairing in the industry, and it is sitting on the roof of nearly every single-story commercial building in America.
Leased Building? The Path Still Exists
Tenants read articles like this one and assume it isn't for them. Three routes say otherwise. A landlord-tenant structure where the owner installs solar and sells power to tenants below utility rates — increasingly standard in industrial parks — benefits both parties and raises the building's lease-up speed. Green tariffs and community solar subscriptions let a tenant buy solar-sourced power at a discount with zero hardware. And portable businesses with long-horizon leases sometimes negotiate roof rights directly: the tenant funds the array, the lease terms secure the payback period, and the landlord gains building value at no cost. I have seen the last structure close twice in the past year; landlords are far more receptive than tenants assume, because a solar-equipped building appraises higher regardless of who paid for the panels.
Supply Chains and the Security Dividend
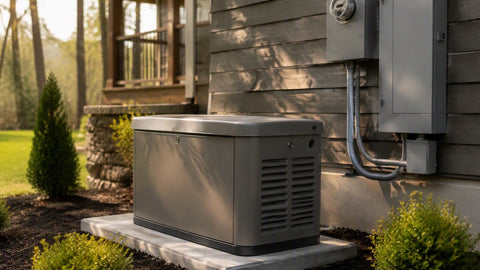
Fossil electricity depends on a continuous physical supply chain — wells, pipelines, rail, refineries — every link of which is a failure point and a geopolitical variable. Solar's supply chain is front-loaded: one delivery, one installation, then twenty-five years of fuel that crosses no borders and answers to no cartel. For businesses with continuity obligations — defense-adjacent manufacturing, food distribution, healthcare — that structural independence has a value that never appears in the LCOE table but shows up clearly in enterprise risk assessments. Pair the array with storage from the energy storage catalog and, where code or operations demand it, a standby unit from the standby generator line, and the facility's energy supply becomes a controlled internal system rather than an external dependency.
The First Step Costs Nothing
Every number in this article is verifiable against your own bills within an hour: pull twelve months of statements, note the blended rate and the demand charges, and run the ROI calculation for your zip code. If the payback lands outside your threshold, file it and check again when rates rise — they will. If it lands inside, the only remaining question is which quarter you start. We quote equipment packages at component level with no financing games attached; bring your interval data and we will tell you what the project actually costs and, just as plainly, when it does not pencil.
Seeing It From the Utility's Side of the Meter
Understanding why utilities price the way they do sharpens the solar decision. A utility's costs are dominated by fixed infrastructure — plants, wires, substations — recovered through rates spread across kilowatt-hours sold. When customers self-generate, the utility's fixed costs remain while its sales volume falls, which is precisely why rate structures keep drifting toward higher fixed charges and demand charges. For the solar customer, the strategic response is twofold: capture today's retail-rate net metering where it still exists (grandfathering clauses typically protect existing systems when rules change), and design for self-consumption so that future rate-structure shifts hurt less. The businesses that installed five years ago under better export terms are, almost to a customer, glad they didn't wait for clarity.
The Roof You Already Own Is an Unproductive Asset

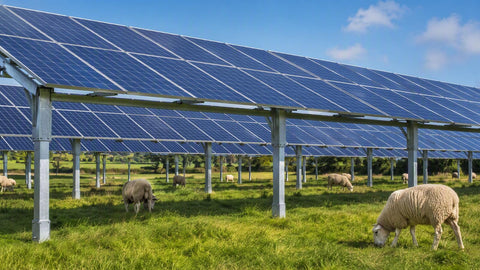
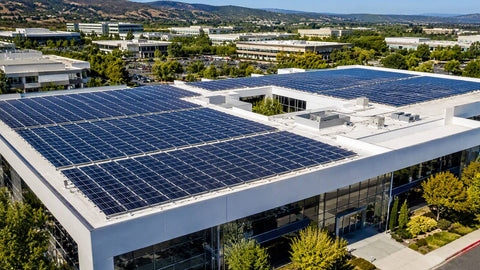
A commercial roof currently earns nothing. It sheds water, holds HVAC condensers, and appreciates at zero percent. The same square footage carrying solar produces a 4–6-cent kilowatt-hour crop every year for a quarter century. Reframed that way, the solar question stops being "should we buy a power plant" and becomes "should we keep leaving the most underutilized asset on our balance sheet idle." For buildings where the roof is unsuitable, the same logic applies to the parking lot (carports) and the back forty (ground mounts) — every commercial property we survey has a solar surface; not every owner has bothered to look. Our racking systems guide maps the mounting options to each surface type.
The Cost of Waiting, Quantified
Every year of delay has a price: one year of full retail electricity spend that solar would have offset. For the 150,000 kWh manufacturer in the worked example above, waiting costs about $21,000 per year in foregone savings — and the "wait for better technology" argument has been losing that trade continuously since 2015, because panel prices already fell the 90% everyone was waiting for. I keep a simple rule I share with every hesitant customer: if the payback is under seven years and you plan to own the building that long, the waiting strategy has a negative expected value, and the spreadsheet is not ambiguous about it.
Your First 90 Days
Converting this article into a project takes one quarter. Weeks 1–2: assemble twelve months of utility bills and interval data, and walk the property with solar eyes — roof condition, shading, panel location, land. Weeks 3–6: solicit three engineering-grade quotes and grade them against the five-number standard (DC size, production with stated PR, gross $/W, itemized incentives, 25-year cash flow). Weeks 7–10: structure the capital — cash, loan, or PPA — with your CPA confirming tax appetite. Weeks 11–13: sign, and let the interconnection clock start. From there the sequence in the earlier transition section takes over. The businesses that capture solar economics aren't the ones with the best negotiators; they're the ones who started the paperwork while competitors were still forming committees.
The Natural Gas Price Record: Why "Cheap Gas" Keeps Lying
Gas-fired electricity's apparent cheapness rests on a commodity that has never stayed cheap for long. The wellhead price history is a sawtooth: under $2 per million BTU in gluts, over $9 in squeezes, and each spike flowed through fuel-adjustment clauses into commercial bills within a billing cycle or two. Solar has no equivalent exposure — the fuel contract for the next twenty-five years was signed at installation, at a price of zero. When I review energy budgets with business owners, this is the moment that lands: I ask them to find a single other input in their operation with gas's volatility record that they would willingly leave unhedged for two decades. There isn't one.
"But My Territory Has Cheap Coal Power"
The objection surfaces in the Midwest and Southeast, and it deserves a real answer rather than dismissal. Legacy coal-heavy territories do post lower retail rates — sometimes 9–11 cents commercial — which stretches solar payback toward the 7–9-year range. Two counterweights preserve the case. First, those rates carry the largest regulatory repricing risk in the country: coal fleets are retiring under economic and environmental pressure, and replacement capacity plus grid investment gets rate-based into the same bills. Second, the ITC-plus-depreciation stack doesn't shrink in cheap-rate states — the incentives are the same dollars, so even the stretched payback lands well inside the asset's first third of life. Cheap territories are where solar projects need sharper pencils, not where they stop working.
The Insurance and Credit Angle Nobody Prices In
Two financial side-effects of a solar transition rarely appear in vendor proposals but show up in real businesses. On insurance: facilities with solar plus storage plus maintained backup power present lower business-interruption risk, and some carriers and brokers now reflect that in underwriting conversations — I have watched a customer's broker use a documented resilience system to hold a premium flat while peers in the same park took increases. On credit: lenders underwriting equipment loans or facility mortgages increasingly treat fixed energy costs as a cash-flow stabilizer, which improves debt-service coverage ratios on paper exactly the way it does in reality. Neither effect is large enough to drive the decision; both are free tailwinds that make the strong case marginally stronger.
When Rates Rise Faster Than 3%
Every table in this article uses the polite historical average for rate escalation. In territories where utilities have filed double-digit increases — and there have been several in recent rate cycles — the solar case doesn't just hold, it accelerates: payback compresses by a year or more and lifetime savings climb proportionally. You don't need to predict which territories spike next; you only need to notice that the downside scenario for solar owners is "rates rise slowly," while the downside scenario for non-owners has no ceiling. Hedging that asymmetry is what treasury departments exist to do; solar just happens to be the hedge that also pays a yield, year after year, without a single phone call to a broker.
Frequently Asked Questions
Is solar really cheaper than fossil fuel electricity for businesses? Yes, in most US markets. Post-incentive commercial solar delivers power at roughly 3–6 cents per kWh locked for 25 years, against utility commercial rates of 11–24 cents that escalate annually.
How much can a business save by switching to solar? A facility spending $20,000+ annually on electricity typically saves $400,000–$580,000 over 20 years net of all system costs, depending on local rates, tariff structure, and solar resource.
What about cloudy days and nighttime? The grid remains your supplier when the sun isn't shining. Solar is a cost-arbitrage tool — every self-generated kWh replaces a retail-priced kWh — not a requirement to disconnect.
How long until a commercial solar system pays for itself? Typical simple payback is 4–7 years with current incentives in moderate-to-high rate territories, followed by 18+ years of near-free generation.
Does solar protect against future fossil fuel price spikes? Completely, for the portion you self-generate. Fuel-cost adjustment clauses, demand-charge escalation, and rider increases only apply to the kilowatt-hours you still buy.
What size system does a typical small business need? A business using 150,000 kWh a year needs roughly 100–120 kW of solar in an average-sun climate — about 175–210 modern high-wattage modules on 7,000+ square feet of roof or ground.