I've had the same conversation at kitchen tables and job trailers for years: "Solar sounds great, but what does the electricity actually cost compared to what I'm paying now?" The honest answer requires separating three numbers people constantly mash together — the utility retail rate you pay, the wholesale cost of generating power, and the levelized lifetime cost of a system you own. This guide untangles all three with real math you can audit, then runs the 25-year comparison for a typical home. Spoiler from someone who quotes these systems weekly: the gap is no longer subtle.

Three Different "Costs of Electricity" — Stop Mixing Them
| Number | What It Is | Typical U.S. Range | Who Cares |
|---|---|---|---|
| Retail rate | What your utility bills you per kWh, including generation, transmission, distribution, and overhead | ~$0.10–$0.30/kWh by state (national residential average ≈ $0.17) | You — this is what solar offsets |
| Wholesale / generation cost | What it costs a power plant to produce a kWh | ~$0.03–$0.15/kWh by source | Utilities and markets |
| LCOE (levelized cost of energy) | All-in lifetime cost of building and operating a generation asset ÷ lifetime kWh produced | Source-dependent; table below | Anyone comparing technologies honestly |
The confusion matters because solar competes at retail when it's on your roof (every kWh your panels make is a kWh you don't buy at $0.17) but at wholesale when it's a utility farm. Rooftop solar's real competitor isn't a gas plant's 4-cent generation cost — it's your 17-cent delivered rate. Keep that straight and half the bad arguments about solar economics evaporate.
LCOE by Source: The Published Ranges
Lazard's annual Levelized Cost of Energy analysis is the reference bankers and utilities actually use. Their recent unsubsidized utility-scale ranges (rounded, and shifting slightly year to year — check the current edition for decisions):
| Source | Unsubsidized LCOE Range (per kWh) | Trend Over the Past Decade | Key Cost Driver |
|---|---|---|---|
| Utility-scale solar PV | ~$0.03–$0.09 | Down roughly 80–90% | Module prices and financing |
| Onshore wind | ~$0.03–$0.08 | Down ~60–70% | Turbine scale and capacity factors |
| Natural gas combined cycle | ~$0.045–$0.11 | Flat to up | Fuel price volatility |
| Coal (existing fleet) | ~$0.07–$0.17 | Rising | Fuel, maintenance, environmental compliance |
| Gas peaker plants | ~$0.11–$0.20+ | Rising | Low capacity factor — built to idle |
| Nuclear (new build) | ~$0.14–$0.22+ | Rising in Western markets | Capital cost and construction timelines |
Read the trend column twice. Solar and wind didn't just get cheap — they got cheap while the fossil alternatives held flat or rose, because fuel is a cost you pay forever while silicon and steel are costs you pay once. Every fossil plant's owner wakes up each morning needing to buy fuel at whatever the market demands; a solar farm's "fuel" invoice has read $0.00 since commissioning and will for 30+ years.
Your Roof vs. Your Utility Bill: The Residential Math
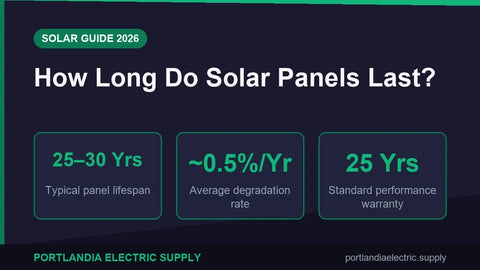
Utility-scale LCOE is interesting, but the decision you're actually making is rooftop solar vs. retail grid power. Here's the worked example I run with customers, using conservative round numbers. Assumptions: 8 kW system, $2.75/watt installed turnkey ($22,000 gross), 30% federal tax credit (net $15,400), production of 1,400 kWh/kWp-year (11,200 kWh year one), 0.5%/year degradation (the NREL median for crystalline modules), retail rate $0.17/kWh escalating 2.5%/year (close to the long-run U.S. average escalation).
| Year | Production (kWh) | Retail Rate ($/kWh) | Annual Value | Cumulative Value vs. $15,400 Net Cost |
|---|---|---|---|---|
| 1 | 11,200 | $0.170 | $1,904 | −$13,496 |
| 5 | 10,980 | $0.188 | $2,064 | −$5,512 |
| 7 | 10,869 | $0.197 | $2,141 | −$1,288 |
| 8 | 10,813 | $0.202 | $2,184 | +$896 (payback) |
| 15 | 10,425 | $0.240 | $2,502 | +$17,300 |
| 25 | 9,867 | $0.308 | $3,039 | +$48,900 |
Under these assumptions — deliberately mid-pack, not cherry-picked sunshine — the system pays back around year 7–8 and then generates roughly $50,000 of additional value over its warranted life. Move the assumptions and the answer moves with them: $0.24/kWh rates (California, Northeast) pull payback to 5–6 years; $0.11 rates (parts of the Southeast and Midwest) push it to 11–13. The structure of the math never changes: solar's cost is fixed at installation, while the fossil-derived retail rate compounds against you. Run your own numbers with our system size calculator and check current equipment pricing in the 400–459W panel collection and renewable energy components.
The Fossil Fuel Cost Stack: What You're Actually Paying For
A fossil kWh carries cost layers that a solar kWh simply doesn't have:
| Cost Layer | Fossil Generation | Rooftop Solar |
|---|---|---|
| Fuel purchase | Continuous, market-priced, volatile | None |
| Fuel transportation | Pipelines, rail, terminals | None |
| Operations staffing | 24/7 plant crews | Effectively none |
| Maintenance | Heavy (turbines, boilers, emissions systems) | Light (cleaning, one inverter replacement over ~25 yrs) |
| Environmental compliance | Scrubbers, permits, ash handling, rising over time | None |
| Capital recovery | Plant construction | System purchase — the dominant cost |
| Price trajectory | Escalates with fuel and compliance costs | Fixed at installation (then free) |
The volatility row deserves emphasis. Natural gas wholesale prices have swung by a factor of five within single years in recent memory; every spike flows into retail rates with a lag. Households and businesses with solar didn't notice those spikes on the covered portion of their load. That's not ideology — it's a fixed-price fuel contract for 25 years, signed once.
Storage Changes the Comparison, Not the Conclusion
The fair criticism of rooftop solar has always been timing: the array makes power at noon and the house needs it at 7 p.m. Net metering policies determine how much that mismatch costs you, and where netting is unfavorable, batteries close the gap. Storage adds cost — but it also converts solar from a discount on your bill into a functioning private utility: peak-shaving, outage ride-through, and arbitrage where time-of-use rates exist. Size storage against your evening load with the solar battery sizing guide and the runtime calculator; the Generac PWRcell cost guide gives a concrete installed-price benchmark for one popular system. Even fully loaded with batteries, solar-plus-storage routinely beats utility retail in high-rate states — and the gap widens every time retail rates step up.
Commercial and Industrial: Where the Math Gets Loud
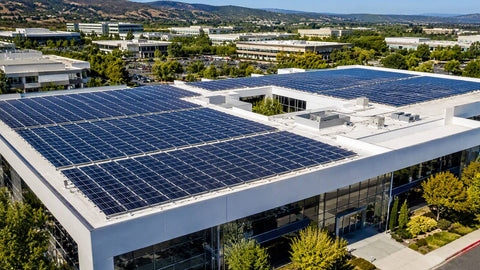
Commercial electricity rates run lower than residential (~$0.08–$0.13 typical), but commercial solar installs cheaper per watt (larger systems, simpler racking, prevailing economics of scale) and — critically — commercial loads peak midday when production peaks. Add accelerated depreciation (MACRS) to the tax credit and commercial paybacks commonly land at 4–7 years. Warehouses with flat roofs are the single best solar asset class in the country: enormous unshaded area, daytime load, and an owner who reads spreadsheets. Our commercial solar installation cost breakdown details the per-watt structure.
The Honest Counterarguments (and Where They Land)
Three legitimate objections come up in every cost debate, and each deserves a straight answer:
- "Solar is intermittent." True, and irrelevant to the bill math under net metering; increasingly manageable with storage as policies shift. Intermittency is a grid-planning challenge, not a household economics one.
- "Panels are made with fossil energy." Also true — and the energy payback on a modern module is roughly 1–2 years of operation, after which it produces clean energy for 25+. The embodied-energy argument died a decade ago; the modules just out-produced it.
- "What if I move?" Studies of home sale data (Lawrence Berkeley National Lab's is the most cited) show owned solar systems adding resale value — typically several dollars per watt — because buyers discount future electric bills into price. Leased systems complicate sales; owned systems enhance them.
Rate Structures: How Your Tariff Changes the Answer
Two homes paying the same "average" rate can get wildly different solar economics because of how the bill is structured. Three structures dominate:
- Flat rate. Every kWh costs the same around the clock. Solar math is simple: production × rate = value. Most of the U.S. still bills this way.
- Time-of-use (TOU). Evening peak hours cost 2–3× off-peak. Solar-only systems export cheap noon power and buy expensive evening power — batteries fix this by shifting noon energy to 7 p.m., and TOU spreads are where storage economics get compelling fast.
- Demand charges (mostly commercial). A monthly fee based on your highest 15-minute draw. Solar shaves demand charges only if production coincides with the peak; storage shaves them reliably. This is why commercial solar-plus-storage is the fastest-growing configuration we quote.
Pull your actual tariff sheet before modeling anything. The utility's website buries it; your installer should read it fluently. If they quote savings without asking about your rate structure, they're guessing with your money.
What Fuel Volatility Actually Looked Like

"Volatile" is abstract until you see the numbers. Wholesale natural gas — the marginal fuel that sets electricity prices across much of the U.S. — has traded between roughly $2 and $9+ per MMBtu within single multi-year windows over the past decade, with regional winter spikes far beyond that. Retail electricity mutes and delays those swings through fuel-adjustment clauses and rate cases, but it doesn't cancel them; the increases arrive on a lag and rarely fully retreat. Meanwhile the "fuel" for a rooftop array has never once changed price, because sunlight has no spot market, no pipeline tariff, and no geopolitics. When I sit with a customer who's annoyed about a 14% rate case, the pitch writes itself: their complaint is the business model for owning generation.
Incentives: The ITC and What Sits Beneath It
The federal Investment Tax Credit has been the backbone of U.S. solar economics — 30% of installed cost returned as a tax credit for qualifying systems under current law. State and utility programs layer on top in many markets: rebates, performance-based incentives, property tax exemptions (solar's added home value untaxed), and sales tax exemptions. Two practical notes from hundreds of quotes: first, the ITC is a credit, not a rebate — you need tax liability to use it, though unused portions carry forward. Second, incentive programs change; model your project with and without each incentive so a policy change delays your payback instead of wrecking it. The worked example above already runs fine at gross cost in high-rate states — incentives are accelerant, not oxygen.
Total Cost of Ownership: The Full 25-Year Ledger
Completing the worked example with the costs people forget to include:
| Line Item | 25-Year Cost (8 kW System) | Notes |
|---|---|---|
| Net system cost (after 30% ITC) | $15,400 | $22,000 gross turnkey |
| Inverter replacement (~year 12–15) | ~$2,000–3,000 | String inverter class; microinverters carry longer warranties |
| Maintenance & cleaning | ~$500–1,500 | Occasional cleaning in dusty regions; annual inspection |
| Monitoring | $0–300 | Most platforms are free at residential scale |
| Total 25-yr ownership cost | ~$18,000–20,000 | Against ~$64,300 cumulative value from the table above |
| Net 25-year benefit | ~$44,000–46,000 | Effective LCOE ≈ $0.07/kWh over ~264,000 lifetime kWh |
That last row is the whole argument in one line: the roof produces a quarter-million kilowatt-hours at an effective seven cents each while the utility alternative compounds from seventeen cents upward. Check the degradation math behind those lifetime kWh against NREL's ~0.5%/year median and the module warranty structure — modern equipment supports every number in this table.
Decision Framework: Does Solar Beat Your Bill?
Five questions, in order, that settle it for any specific property:
- What's your retail rate? Above ~$0.13/kWh, solar usually pencils; below it, look closer.
- What's your solar resource? 1,200–1,700 kWh/kWp-year covers most of the U.S.; the system size calculator handles the translation to your roof.
- Is your roof suitable? Unshaded, structurally sound, and not due for re-roofing within five years. Re-roof first; removal and re-install is a wasted few thousand dollars.
- What's your net metering policy? Full retail netting is the best case; weak netting pushes the design toward self-consumption and storage.
- Can you use the tax credit? Tax liability determines whether the ITC is a year-one benefit or a carry-forward. Talk to your accountant, not just your installer.
Four or five favorable answers and the comparison with fossil electricity stops being close. Two or fewer, and the honest advice might be to fix the roof, trim the trees, or wait for a move — I'd rather tell a customer "not yet" than install a system that underperforms its promise, because that customer tells ten neighbors.
Financing: Cash, Loan, or Lease — and What Each Does to the Math
How you pay changes the economics as much as what you buy. Cash is king: full ITC, full savings, the ~7-year payback from the worked example. Solar loans (10–20 year terms common) trade some savings for zero-down access — a $22,000 system financed at typical rates might carry a $140–180/month payment against a $150–200/month bill offset, so you're roughly cash-flow neutral from month one and fully ahead after payoff; you keep the ITC either way. Leases and PPAs give up the ITC to the financing company in exchange for simplicity and a per-kWh price below your utility rate — savings are real but thinner, and the contract's escalator clause (often 1–3%/year) deserves the same scrutiny you'd give any 20-year obligation. My consistent advice: buy with cash or a loan if you can, lease only if the alternative is doing nothing, and read the escalator and transfer clauses aloud before signing anything.
The EV Multiplier: When Solar Feeds a Car
Add an electric vehicle and the solar equation compounds. A typical EV driven 12,000 miles a year consumes roughly 3,000–4,000 kWh — a 30–40% bump in household electricity demand. Sized for it upfront, the same array covers the car at that effective ~$0.07/kWh lifetime cost, versus $0.17+ retail charging or $0.12–0.16/mile-equivalent gasoline. The EV essentially converts rooftop solar into a gasoline substitute at a fraction of pump prices, and the combined payback of array-plus-car beats either purchase alone. Our EV charging installation cost guide covers the home-charging side of that pairing.
Community Solar and the Renter's Door
One last gap in the fossil-vs-solar comparison worth closing: you don't need to own a roof to leave the fossil rate stack. Community solar subscriptions let renters and shaded-roof owners buy into off-site arrays and receive bill credits at a discount to retail — typically 5–15% savings with no installation, no maintenance, and no roof penetration. The savings are thinner than ownership's, but the comparison that matters isn't community solar vs. rooftop; it's community solar vs. continuing to buy 100% fossil-derived retail power. On that comparison, the subscription wins from the first bill.
The Grid-Scale Confirmation
If the cost argument were merely theoretical, utility construction queues would show it — and they do. Solar has led all sources in new U.S. generating capacity additions for several consecutive years, outpacing gas, wind, coal, and nuclear combined in recent installation data. Utilities and independent power producers are not sentimental about technology; they build whatever produces the cheapest reliable megawatt-hour under their regulatory constraints, and they keep choosing solar-plus-storage at scale. The same LCOE gravity pulling utility procurement toward renewables is what makes your rooftop math work — the residential version just stacks retail-rate arbitrage on top of generation economics. When the people who buy power plants by the gigawatt and the homeowner with a south-facing roof reach the same conclusion from opposite directions, the conclusion stops being controversial.
The capital markets confirm it too: clean-energy investment has outpaced fossil-fuel supply investment globally in recent years, and utility-scale power-purchase agreements for solar keep clearing at prices gas plants can't match without fuel hedges. Money follows the cheapest reliable kilowatt-hour, and the cheapest reliable kilowatt-hour increasingly wears a silicon face. Households running the rooftop version of that math are simply arriving at the same destination as the institutions, one electric bill at a time.
Frequently Asked Questions
Is solar electricity actually cheaper than fossil fuel electricity? At utility scale, yes — recent LCOE analyses put unsubsidized solar (~$0.03–0.09/kWh) below new gas and coal generation. On your roof, solar competes against the retail rate (~$0.17/kWh national average), where properly priced systems deliver lifetime energy at an effective $0.06–0.10/kWh.
What is LCOE and why does it matter? Levelized cost of energy is the all-in lifetime cost of a generation source divided by its lifetime kilowatt-hours — the only apples-to-apples way to compare a fuel-burning plant (cost spread over decades) with a solar array (cost concentrated upfront).
How long until home solar pays for itself? With current pricing and the federal tax credit, typical payback runs 6–10 years depending on your state, rate, and sun exposure — then 15+ years of essentially free production follow. High-rate states pay back fastest.
Do fossil fuel electricity prices keep rising? U.S. residential retail rates have risen roughly 2–3% annually over the long run, with sharper jumps during fuel price spikes. Solar's economics improve every time the utility rate steps up, because your cost stayed fixed at installation.
What about the environmental cost difference? A typical 8 kW rooftop system avoids on the order of 8–10 metric tons of CO₂ per year versus average U.S. grid generation — the equivalent of taking roughly two gasoline cars off the road, sustained for decades. Module manufacturing emissions are repaid within the first 1–2 years of operation.
Should I add batteries to make the economics work? Usually no for pure bill savings under full retail net metering — solar alone pencils. Where netting is weak or time-of-use spreads are wide, storage adds resilience and arbitrage value that can justify its cost. Model both scenarios before deciding.
Where the Numbers Leave You
The cost debate between solar and fossil electricity was settled in the market before it was settled in the discourse: capital now flows to renewables because the levelized math wins, and rooftop systems win against retail rates in most of the country before a single incentive is counted. Your specific answer depends on your rate, your roof, and your state's net metering rules — three numbers we can model in one conversation. Start with the solar panel kits buyer's guide, price the equipment in our components collection, and send us your address and a recent bill for a real quote instead of a national average.