A solar array without monitoring is a hope, not an asset. The production report you show a lender, the warranty claim you file in year nine, the truck roll you avoid in year two — all of it runs on the data pipeline you bolt onto the array. IoT monitoring has collapsed the cost of that pipeline from five-figure SCADA systems down to a few hundred dollars of sensors and a cellular gateway, and it has changed what "managing" a renewable energy asset actually means. This guide covers the hardware, the protocols, the connectivity trade-offs, and the math, written from the installer and asset-manager side of the fence.

If you are speccing a system now, our monitoring and communications collection carries the gateways, meters, and sensor packages referenced below.
What IoT Monitoring Actually Measures
"Monitoring" gets sold as a single feature, but it is a stack of measurement layers, each with its own hardware and failure modes:
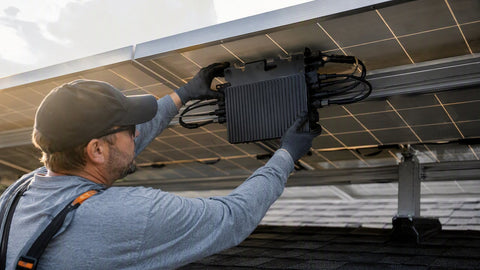
- Module level: Per-panel voltage, current, and temperature from microinverters or DC optimizers. The gold standard for fault isolation.
- String level: Current and voltage per source circuit, measured at the combiner or inside string inverters. Catches blown fuses, shading events, and connector failures.
- System level: AC power at the inverter output and revenue-grade energy at the utility interconnect. This is the layer that pays bills and satisfies incentive programs.
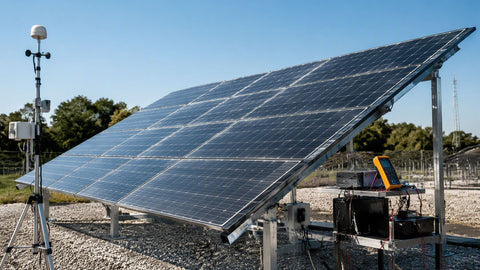
- Environmental: Plane-of-array irradiance, ambient and cell temperature, wind speed, and soiling. Without these, you cannot separate "the array is broken" from "the weather is bad."
- Balance of plant: Battery state of charge, generator runtime, transfer switch position, and consumption metering behind the meter.
I once spent a week chasing an "8% underperforming" commercial array that turned out to be a drifting irradiance sensor — the array was fine, the reference was lying. Since then I treat the environmental sensor package as the foundation of any monitoring spec, not an accessory. A $400 pyranometer protects the credibility of every other number the system reports.
Monitoring Tiers: What Each Level Costs and Catches
| Tier | Granularity | Typical Hardware Cost (Residential) | Faults It Catches | Faults It Misses |
|---|---|---|---|---|
| System-level only | Whole-array kWh | $0 (inverter built-in) | Total outages, inverter faults | Anything under ~15% degradation; single-module failures |
| String-level | Per source circuit | $200–$800 (combiner monitors) | Blown string fuses, ground faults, major shading | Single-module hotspots, optimizer-level issues |
| Module-level (MLPE) | Per panel | Included with microinverters/optimizers | Per-module faults, diode failures, PID patterns, soiling maps | AC-side and metering issues |
| Revenue-grade + environmental | Utility-meter class + weather | $500–$1,500 | Performance-index truth; separates weather from faults | Nothing structural — but adds cost and calibration burden |
The tier decision is economic. On a 10 kW house, module-level data costs nothing extra because it rides along with MLPE electronics. On a 2 MW industrial plant, string-level monitoring plus a good environmental station is usually the sweet spot — per-module sensing at that scale means thousands of reporting nodes and a data bill to match.
The Protocols: How the Data Actually Moves
Every solar IoT conversation eventually hits the protocol layer, and this is where integrations succeed or stall:
| Protocol | Physical Layer | Where You Meet It | Strengths | Watch Out For |
|---|---|---|---|---|
| Modbus RTU | RS-485 twisted pair | Inverters, meters, charge controllers | Universal, cheap, noise-tolerant over long runs | Register maps differ per vendor and firmware revision; termination and biasing errors cause ghost faults |
| Modbus TCP | Ethernet / LAN | Three-phase inverters, plant controllers | Fast, easy to network, no wiring quirks | Exposed on the LAN — put it behind a VLAN or firewall |
| SunSpec | Runs over Modbus RTU/TCP | North American inverter fleet (standardized models) | Standard data models mean one integration covers many brands | Not every vendor implements every model; verify the specific models list |
| CAN bus | Twisted pair, differential | Battery BMS-to-inverter links | Real-time, robust, designed for noisy electrical environments | Vendor-specific profiles; a mismatched battery profile can limit charge rates or void warranties |
| Vendor cloud API | HTTPS / REST | Residential fleets, O&M dashboards | Zero field wiring; instant portfolio views | You rent your own data — export limits, API rate caps, and platform sunset risk |
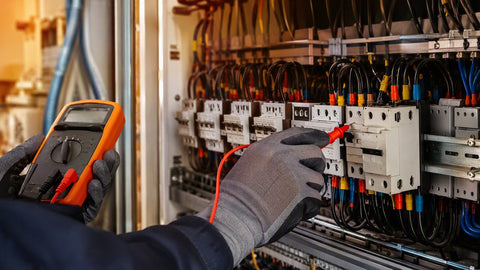
War story, because it teaches the right lesson: I drove three hours to a commercial site reporting "inverter offline." The fix was a $12 RS-485 termination resistor. The inverter was never broken; the last device on the daisy chain had no termination, reflections garbled the bus, and the gateway gave up polling. Now every commissioning checklist I write ends with "meter the bus, verify termination, log poll success rate for 24 hours" before we call a site done.
Connectivity: Getting Data Off the Roof
| Link | Typical Monthly Cost | Uptime Reality | Best Use |
|---|---|---|---|
| Site Ethernet / LAN | $0 (uses existing network) | Excellent if IT-managed; terrible if the router gets factory-reset by a tenant | Commercial sites with IT staff and VLANs |
| Wi-Fi | $0 | The weakest link — credential changes and AP swaps kill it silently | Residential, only when Ethernet is impossible |
| Cellular (LTE-M / Cat-1 / 4G) | $3–$15 per device | Very good; independent of site IT | Default for anything revenue-critical or remote |
| LoRaWAN (site-local) | ~$0 after gateway | Excellent for sensor meshes on large sites | Ground-mount weather stations, multi-building campuses |
My standing recommendation: cellular for the primary path on anything that generates revenue or warranty value, Ethernet as the secondary. Cellular costs a few dollars a month and answers to nobody's IT department. We stock cellular modems and communication gateways that ship pre-provisioned for exactly this reason — an hour of provisioning at the bench saves a day of finger-pointing between the installer and the customer's IT contractor.
The Sensor Package That Separates Signal from Weather
| Sensor | Accuracy Class to Buy | What It Proves |
|---|---|---|
| Pyranometer (plane-of-array) | IEC 61724 Class B or better (Class A for utility) | Actual irradiance resource — the denominator of every performance ratio |
| Module back-of-cell temperature | ±1°C RTD or T-type thermocouple | Converts irradiance into expected power via temperature coefficient |
| Ambient temperature | ±0.5°C, shielded | Soiling and thermal modeling; warranty-grade records |
| Revenue meter | ANSI C12.20 0.2% class for SREC/incentive programs | The billable kWh; utility-grade proof for incentive claims |
| Soiling station (paired reference cells) | Matched modules, one cleaned / one not | Soiling loss in percent — tells you when washing pays |
The performance ratio calculation is where this all pays off. PR = actual kWh ÷ (POA irradiance in kWh/m² × array kWp at STC). A healthy fixed-tilt system runs 0.80 to 0.88. If your monitoring shows 0.74 on a clean array with a verified irradiance sensor, you have a real electrical problem worth a truck roll. Without the irradiance and temperature sensors, that same 0.74 could be a hazy month and the truck roll is a waste of $400.
Alerting: Where Monitoring Earns Its Keep
Data without alerts is archaeology. Configure three alarm classes and route them differently:
- Safety alarms (immediate, phone call/SMS): ground faults, arc faults, rapid shutdown triggers, battery thermal warnings. These are nights-and-weekends events.
- Production alarms (within 24 hours, email/ticket): string deviation over 10% versus peers, inverter clipping outside expected windows, PR below 0.78 for three consecutive clear days.
- Drift alarms (weekly digest): gradual degradation trends, soiling accumulation, rising cell temperatures at constant ambient — the slow leaks that a weekly review catches before they become warranty arguments.
The 10% string-deviation rule deserves explanation: on a 12-string commercial roof, one string producing 10% below its identical neighbors for three clear days is almost always a hardware fault, not weather. Weather moves strings together; faults move one string. That single heuristic has caught more failed optimizers on my watch than any other alarm in the stack.
IoT and the Wider Energy Management Picture
Monitoring data becomes management value when it drives decisions: dispatching battery storage against demand peaks, scheduling EV fleet charging into solar surplus windows, or staging generator runtime for off-grid sites. The pipeline is the same — sense, transport, store, alert, act — whether the asset is a 6 kW cabin or a 5 MW plant. What changes is the cost of being wrong.
For hybrid systems, make sure the battery BMS, inverter, and monitoring platform share one data model. A battery reporting SOC on a vendor cloud while the inverter reports power over local Modbus is two dashboards and one confused operator. A single data manager or gateway that aggregates both, plus the temperature sensors and revenue meter, is worth its cost in avoided confusion alone. Pair the monitoring layer with the right power electronics — our solar inverters catalog lists which units expose SunSpec models natively, and the Enphase and SolarEdge lines carry module-level telemetry built in.
What IoT Monitoring Costs — and What It Recovers

| System Size | Sensible Monitoring Budget | Typical Undetected-Loss Exposure Without It | Payback Logic |
|---|---|---|---|
| 8–12 kW residential | $0–$300 (MLPE-included) | One dead module ≈ 3–8% annual energy ≈ $60–$150/yr | Module-level data rides free with microinverters — take it |
| 50–100 kW commercial | $800–$2,500 | One failed string ≈ 8% ≈ $1,500–$3,000/yr | One caught string fault in year 1 pays for the package |
| 1–5 MW industrial | $8,000–$25,000 (incl. environmental station) | 2% undetected soiling/fault loss on 1.5 GWh ≈ $25,000+/yr at $0.09/kWh | Weeks, not years — if alerts are actually staffed |
That last qualifier is the honest one. Monitoring that nobody watches recovers nothing. Assign the alerts to a named human with a response SLA, or pay an O&M provider to do it. The cheapest monitoring plan with an owner beats the fanciest dashboard with an audience of zero, every single time.
Security: The Part Everyone Skips
IoT devices on a plant network are an attack surface. Three rules cover most of the risk: change default credentials at commissioning (and record them in the O&M manual), isolate plant control networks on a VLAN with no direct internet exposure, and keep gateway firmware on a patch schedule like any other IT asset. A solar gateway with factory passwords and a public IP is not hypothetical risk — security researchers publish scans of exactly those devices every year.
How the Data Pipeline Is Built, End to End
Walk the pipeline once and the architecture decisions make themselves:
- Sense. Meters, sensors, and power electronics convert physical reality into registers. Accuracy classes matter here and nowhere else.
- Concentrate. A gateway polls devices on a schedule — typically every 1 to 15 minutes — normalizes register maps into a common data model, and buffers data locally when the uplink drops. Local buffering is non-negotiable: networks fail, and a gateway that drops data during an outage has destroyed exactly the evidence you needed.
- Transport. Cellular or Ethernet carries batched payloads upstream. Payloads are small; reliability, not bandwidth, is the design constraint.
- Store. A time-series database keeps raw intervals, rollups, and alarm events. Retention policy is a contract term on financed systems — five to ten years of interval data is a common lender requirement.
- Analyze. Expected-yield models compare actual production against irradiance-adjusted expectation. This is where performance ratio, availability, and soiling metrics get computed.
- Act. Alerts route to people, work orders route to trucks, and API exports route to lenders, incentive administrators, and the customer's own dashboards.
Buy against this pipeline, not against a feature checklist. A platform that demos beautifully but cannot buffer data through a three-day network outage, or cannot export raw intervals via API, will fail you at exactly the wrong moment.
Fleet and Portfolio Monitoring: Where IoT Really Scales
One site is a hobby. Fifty sites are an operations problem, and IoT is the only economical answer to it. Portfolio platforms aggregate every site's KPIs onto one screen: fleet-wide performance ratio, availability, open alarm counts by severity, and mean time to repair. The metrics that matter at portfolio scale are different from single-site metrics:
| Portfolio Metric | Healthy Target | What It Tells You |
|---|---|---|
| Fleet availability | > 99% | Share of daylight hours the plant could produce; pure uptime measure |
| Weather-adjusted performance ratio | 0.80–0.88 (fixed-tilt) | Efficiency of converting available sun to delivered energy |
| Mean time to detect (MTTD) | < 24 hours | How fast faults surface — a monitoring quality metric |
| Mean time to repair (MTTR) | < 14 days | How fast trucks roll and parts arrive — an O&M quality metric |
| Alarm resolution rate | > 95% within 30 days | Whether alerts are staffed or decorative |
The MTTD row is the one owners underestimate. A fault that takes 90 days to surface has already burned a quarter-year of production on that string. Across a 50-site fleet, slow detection routinely costs more energy than the faults themselves. This is why I push clients to measure detection speed as aggressively as they measure production — you cannot fix what you have not noticed, and fleets do not notice anything without instrumentation.
Predictive Maintenance: Honest Version
The sales pitch says machine learning predicts failures before they happen. The field reality is narrower but still valuable: trend analysis reliably catches three slow failures before they become outages. I-V curve tracing drift shows module degradation or series resistance climbing from corroding connectors. Insulation-resistance trending catches cable insulation breakdown weeks before a ground fault trips the array offline. And inverter thermal trends — rising heatsink temperatures at constant load — flag fan failures and dust-clogged filters before the inverter derates itself in August.
None of that requires exotic AI. It requires consistent interval data, a baseline from commissioning, and someone who looks at trends monthly. Set the expectation correctly with customers: predictive maintenance prevents maybe 30% to 40% of unplanned downtime, the downtime it does prevent is the expensive slow kind, and it only works on top of clean, continuous data. Garbage telemetry predicts garbage.
From Alert to Work Order: Closing the Loop
The last mile of monitoring is organizational, not technical. An alert that lands in a shared inbox and waits for someone to notice is a monitoring failure with extra steps. Mature operations wire the alarm system directly into a ticketing or work-order system with three fields attached to every ticket: expected energy loss per day (so triage has a dollar value), the probable fault class (so the truck carries the right parts), and the access notes (gate codes, roof hatch keys, escort requirements — the things that actually delay repairs).
Price your response tiers honestly. A residential customer losing $4 a day to a dead optimizer does not need a next-day truck roll; a demand-metered commercial site losing $90 a day does. Monitoring data lets you make that triage decision with arithmetic instead of guilt, and it gives the customer a transparent answer when they ask why their ticket is scheduled Thursday instead of tomorrow.
A Buyer's Checklist for Solar IoT Hardware
Before you sign a monitoring PO, verify these eight items — every one of them has bitten a real project I have touched:
- Local data buffering of at least 30 days on the gateway, with automatic backfill after outages.
- Published API with raw interval export, in writing, not "available on request."
- Protocol support matched to your exact inverter and meter models, by firmware version.
- Cellular uplink option with multi-carrier SIM for rural sites.
- Sensor accuracy classes stated on the datasheet (Class B minimum for irradiance on commercial work).
- Alarm routing to email, SMS, and a webhook into your ticketing system.
- Firmware update mechanism that does not require a site visit.
- Data ownership and retention terms that survive the vendor's business model — read the sunset clause.
Commissioning the Monitoring System: Tests That Prevent Ghost Stories
Most monitoring problems are born on commissioning day. Run these five tests before you leave the site:
- Register sanity check. Compare gateway-reported power against the inverter's own display under load. A scaling-factor error of 10× is invisible at night and embarrassing at noon.
- Uplink failover test. Pull the Ethernet cable and confirm the cellular path takes over and buffers correctly. Then kill both and verify backfill after reconnection.
- Sensor cross-check. On a clear day near solar noon, the pyranometer should read within a few percent of clear-sky expectation for that date and latitude. If it reads 400 W/m² at noon in June, the mounting angle is wrong or the sensor is shaded at noon — find out now, not during a warranty claim.
- Alarm delivery drill. Trigger a test alarm and time its delivery to the actual on-call phone. If the drill alarm takes 40 minutes to arrive, production alarms will too.
- Baseline snapshot. Record a clean first-week production profile as the commissioning baseline. Every future "is it degrading?" conversation starts from this file.
These five take about two hours and cost nothing. Skipping them costs the first three service calls of the system's life, because every troubleshooting session begins by doubting the data instead of trusting it.
Frequently Asked Questions
Do I need module-level monitoring on a home solar system?
If your system uses microinverters or DC optimizers, you already have it — the telemetry is built in. With a string inverter, adding module-level electronics purely for monitoring rarely pencils out; string-level data plus an annual production review catches most residential problems.
What is the difference between monitoring and SCADA?
Monitoring observes and reports. SCADA (supervisory control and data acquisition) also controls — curtailment commands, power factor setpoints, breaker trip commands. Residential and small commercial systems need monitoring; utility-scale plants with interconnection-driven control requirements need SCADA.
How much data does a solar monitoring system use?
Surprisingly little. A residential gateway reporting at 5- to 15-minute intervals uses roughly 50–150 MB per month. Even large commercial sites with string-level data stay under 1 GB monthly, which is why low-cost LTE-M and Cat-1 plans fit solar telemetry so well.
Can I monitor batteries and generators on the same platform?
Yes — modern gateways aggregate battery BMS data (usually CAN), inverter data (Modbus/SunSpec), and generator controllers (Modbus) into one dashboard. Verify protocol support per device before purchase; see our energy storage systems guide for the battery side.
What accuracy do I need for SREC or incentive reporting?
Most U.S. incentive programs require a revenue-grade meter meeting ANSI C12.20 at 0.2% or 0.5% accuracy class. The inverter's built-in energy counter usually does not qualify — check the program rules before you rely on it.
Why did my monitoring stop after a router change?
Wi-Fi-based gateways lose their credentials when the router or password changes, and they fail silently — the array keeps producing, the dashboard just goes dark. This is the single most common "monitoring failure" in the field, and the reason cellular uplinks are the default recommendation for anything that matters.