The average American home uses about 10,500 kWh of electricity per year — roughly 875 kWh per month, 29 kWh per day, and an average continuous load of about 1.2 kW. But "how many kW does a house use" is really two questions wearing one trench coat: how much power a home draws at any moment (kW), and how much energy it consumes over time (kWh). The first number sizes your panel, inverter, and generator. The second sizes your solar array and your electric bill. This guide nails down both, with the state-by-state data, appliance-by-appliance demand tables, and service-sizing math that let you find your own home's numbers.
When I audit a home for solar or backup power, the first document I ask for is twelve months of electric bills. Everything below is how I read them — and how you can too.
kW vs. kWh: The Confusion That Wrecks Solar Quotes
| Term | What It Measures | House Analogy | Typical US Home Value | What It Sizes |
|---|---|---|---|---|
| kW (kilowatt) | Power — the rate of use at an instant | How wide the pipe is | ~1.2 kW average; 5–12 kW peak | Service panel, inverter, generator, wire size |
| kWh (kilowatt-hour) | Energy — power × time | How much water flowed | ~875 kWh/month; ~10,500 kWh/year | Solar array size, battery capacity, your bill |
A 2 kW window air conditioner running 3 hours uses 6 kWh. Ten LED bulbs at 10W each draw 0.1 kW and use 2.4 kWh per day. Every number in this article — and every number on your bill — is one of those two units, and mixing them up is how homeowners end up quoted a "10 kW system" when they needed 10,000 kWh of annual production.
The National Picture: What an Average US House Actually Uses
The US Energy Information Administration's residential data puts the average American household at roughly 10,500 kWh per year. The average hides a spread of more than 2:1 between states, driven mostly by air conditioning, electric heat, and water heating:
| State / Region | Avg Monthly Usage (kWh) | Avg Annual Usage (kWh) | Avg Continuous Load (kW) | Primary Driver |
|---|---|---|---|---|
| Louisiana | ~1,200 | ~14,400 | ~1.64 | Air conditioning + electric water heat |
| Texas | ~1,100 | ~13,200 | ~1.51 | Air conditioning |
| Florida | ~1,100 | ~13,200 | ~1.51 | Air conditioning |
| National average | ~875 | ~10,500 | ~1.20 | Mixed |
| New York | ~600 | ~7,200 | ~0.82 | Gas heat dominant; modest AC |
| California | ~550 | ~6,600 | ~0.75 | Mild climate, small homes |
| Hawaii | ~530 | ~6,400 | ~0.73 | Minimal heating/cooling |
Reading the kW column: divide monthly kWh by 730 hours to get average continuous load. A home using 875 kWh/month averages 1.2 kW around the clock — but that is an average of midnight lows around 0.2–0.4 kW (refrigerator, network gear, standby loads) and evening peaks of 5–12 kW when the range, dryer, AC, and water heater overlap. Both numbers matter, and they answer different questions.
What Uses the kW: Appliance Demand and Energy Table
| Load | Power Draw (kW) | Typical Annual Energy (kWh) | Share of Typical Home |
|---|---|---|---|
| Central air conditioner (3-ton) | 3.0–4.5 running; 10+ at startup (soft-start kits cut this) | 1,500–3,500 | 15–30% in the South |
| Electric furnace / strip heat | 10–20 | 2,000–8,000 where used | Dominant winter load |
| Heat pump (3-ton) | 2.5–4.0 | 1,500–4,000 (heat + cool) | 20–40% in mixed climates |
| Electric water heater | 4.5 | 2,500–4,500 | 12–18% |
| Electric range/oven | 2–8 (cycling) | 400–700 | ~5% |
| Electric dryer | 5.0 | 700–1,000 | ~8% |
| EV charging (Level 2) | 7.2–11.5 | 2,500–4,000 per EV (~12,000 mi/yr) | Grows every year |
| Refrigerator | 0.1–0.2 (cycles) | 400–800 | ~5% |
| Pool pump | 1.0–2.0 | 1,500–3,000 | Big where present |
| Lighting (whole house, LED) | 0.1–0.4 | 300–600 | ~5% |
| Electronics, standby, networking | 0.1–0.3 continuous | 800–1,500 | ~10% — the silent baseline |
Add the right-hand column and you get roughly 100% — that is the anatomy of the average 10,500 kWh. Your home's anatomy will differ, and finding out how is exactly what the power consumption calculation guide walks through, circuit by circuit. For the raw watts version of this question, the companion piece on how many watts it takes to power a home covers the backup-power angle.
House Size vs. Usage: A Sanity-Check Table
| Home | Typical Monthly kWh | Typical Annual kWh | Avg Load (kW) | Summer Peak Demand (kW) |
|---|---|---|---|---|
| Apartment / condo (800 sq ft, gas heat) | 300–550 | 3,600–6,600 | 0.4–0.75 | 2–4 |
| Small house (1,200 sq ft) | 500–800 | 6,000–9,600 | 0.7–1.1 | 3–6 |
| Average house (1,800–2,200 sq ft) | 750–1,100 | 9,000–13,200 | 1.0–1.5 | 5–9 |
| Large house (3,000+ sq ft, all-electric) | 1,200–2,000 | 14,400–24,000 | 1.6–2.7 | 8–15 |
| Large all-electric + 2 EVs + pool | 2,000–3,000+ | 24,000–36,000+ | 2.7–4.1 | 12–20 |
I have audited 1,400-square-foot homes burning 1,500 kWh a month (ancient strip heat, leaky ducts) and 3,000-square-foot homes sipping 700 (heat pump, good envelope, no pool). Square footage is a starting point, not an answer — the bill is the answer.
Peak Demand: The kW That Sizes Your Service
Your utility bill mostly cares about kWh. Your electrical panel cares about kW. Residential services are sized by a demand calculation (NEC Article 220, with the optional method in 220.83 for existing homes adding loads) that estimates worst-case simultaneous demand:
| Service Size | Capacity at 240V | Continuous Safe Capacity (80% rule) | Typical Home It Serves |
|---|---|---|---|
| 100A | 24 kW | ~19 kW | Older homes, gas heat, no EV; tight once you add electric cooking + AC |
| 150A | 36 kW | ~29 kW | Mid-size all-electric homes |
| 200A | 48 kW | ~38 kW | Modern standard; handles heat pump + EV + electric water heat comfortably |
| 400A | 96 kW | ~77 kW | Large all-electric estates, dual EVs, pools, workshops |
The pattern I see weekly: a 100A home that was fine for forty years becomes undersized the day someone adds a heat pump water heater and a Level 2 EV charger. If that is your trajectory, read the service upgrade guide before the EV arrives, not after the breaker starts nuisance-tripping. Converting between amps and kW at various voltages is covered in the kWh-to-amps reference.
From kWh to Solar: Sizing the Array Off Your Bill
Solar sizing is where the kWh number earns its keep. The formula:
System size (kW) = Annual kWh ÷ (peak sun hours × 365 × system efficiency)
Using 4.5 PSH (national-ish average) and 0.80 system efficiency (inverter, wiring, soiling, temperature losses):
| Annual Usage | System Size Needed (kW) | Panels @ 450W | Roof Area Needed (approx) |
|---|---|---|---|
| 6,000 kWh (efficient home) | ~4.1 kW | 9–10 | ~180 sq ft |
| 9,000 kWh | ~6.2 kW | 14 | ~270 sq ft |
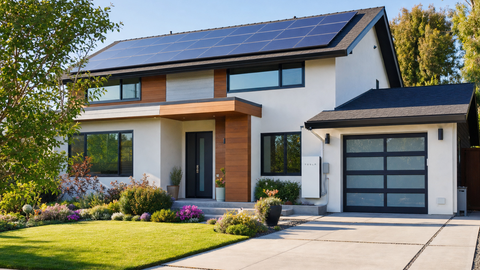
| 10,500 kWh (national average) | ~7.2 kW | 16 | ~310 sq ft |
| 13,000 kWh (Southern average) | ~8.9 kW | 20 | ~390 sq ft |
| 18,000 kWh (large all-electric) | ~12.3 kW | 28 | ~540 sq ft |
Check the math: 10,500 ÷ (4.5 × 365 × 0.80) = 10,500 ÷ 1,314 = 7.99... at 0.80 efficiency that is ~8.0 kW; with the slightly more optimistic 0.82–0.85 real-world derate many designers use, 7.2–7.8 kW lands within 5% of the same answer. Being explicit about the efficiency assumption is what separates a quote you can trust from a quote built on a sunny fantasy. The solar system calculator and the system size calculator guide run this math with your actual PSH, and current panel options live in the solar panel catalog and solar kits section.
From kW to Backup: Sizing Generators and Batteries
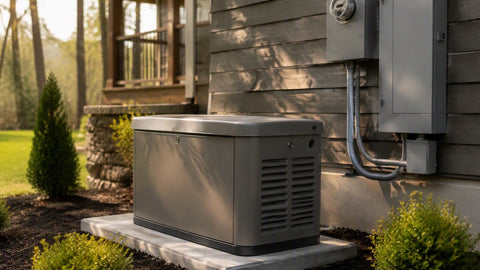
Backup power sizing works off the peak-demand column instead. A whole-house standby unit must cover your largest simultaneous loads — typically AC plus water heater plus kitchen — which lands most average homes at 14–26 kW. The generator sizing guide and the 2026 whole-home generator guide cover the load-shedding tricks that let a 14 kW unit do a 22 kW job; hardware is in the standby generator collection. Battery backup splits the difference: kW for the surge, kWh for the runtime — the battery bank sizing guide handles both.
How to Find Your Own Numbers in 15 Minutes
- Pull 12 months of bills (or your utility's usage portal). Sum the kWh. That is your annual number — the one that sizes solar.
- Find your peak month (usually August or January). Peak month × 1.15 is a defensible design ceiling.
- Spot your baseline. Look at overnight usage on a smart-meter portal, or read the meter at 3 AM versus 3 PM. The overnight floor — usually 0.2–0.5 kW — is standby and refrigeration, and trimming it is the cheapest efficiency win available.
- List the big five: HVAC, water heater, dryer, range, EV. Their duty cycles explain 60–80% of most bills.
- Decide what you are sizing — solar (kWh), generator (peak kW), or service panel (peak kW with NEC demand factors) — and use the matching column from this article.
Field Notes
Two lessons from a decade of audits. First, the bill never lies, but the label often does: I have measured "1,500W" space heaters drawing 1,650W and nameplate-5-ton AC units pulling 20% under rating on soft starts — measured beats nameplate when the decision is expensive. Second, usage grows: nearly every family I have re-audited after five years added 10–25% (an EV, a hot tub, teenagers with gaming rigs). When I size solar on a young household, I add 15% headroom and have never once had a customer complain about the extra panels.
How American Home Usage Has Changed
The 10,500 kWh national average is not a constant — it is a snapshot of a moving target. Understanding the trend matters when you are sizing infrastructure meant to last decades:
| Era | Avg Annual Usage | What Changed |
|---|---|---|
| 1970s | ~7,000–8,000 kWh | AC adoption begins; electric water heat spreads |
| 1990s | ~10,000 kWh | Central AC standard; bigger homes; more electronics |
| 2005 peak | ~11,500 kWh | Largest average homes; plasma TVs; desktop PCs everywhere |
| 2010s | ~10,700 kWh declining | LED lighting, efficient appliances, flat-screen TVs claw usage back |
| 2020s | ~10,500 kWh, turning up | EVs, heat pumps, and electrification begin the next climb |
The efficiency era masked itself well: homes got bigger while usage stayed flat because LEDs, variable-speed HVAC, and better envelopes ate the growth. That free ride is ending. The two biggest electric loads in history — EVs and heat pumps — are arriving simultaneously, and they do not get efficient fast enough to offset their own adoption.
The Electrification Surge: Planning for the Home of 2030
If you are sizing anything today — a service panel, a solar array, a generator — size it for the loads that are coming, not the loads you have. The typical additions:
| Incoming Load | Added Annual kWh | Added Peak Demand (kW) | Adoption Trajectory |
|---|---|---|---|
| First EV, Level 2 home charging | 2,500–4,000 | 7.2–11.5 while charging | Already mainstream; the #1 driver of service upgrades I quote |
| Second EV | +2,000–3,500 | Managed/shared charging keeps peak near one EV's | Follows the first by 2–4 years in most households |
| Heat pump (replacing gas furnace) | +2,000–5,000 (climate-dependent) | 2.5–4 running; auxiliary strips can add 10 | Accelerating under rebate programs |
| Heat pump water heater | +800–1,200 (but −2,500 gas-equivalent) | 0.5–1.5 | The easiest electrification win; pays back fast |
| Induction range | +100–300 | Up to 10 peak, briefly | Steady adoption |
Stack a typical electrification path — one EV, heat pump, heat pump water heater — and a 10,500 kWh home becomes a 15,000–16,000 kWh home whose peak demand nearly doubles. The families who sized their 2023 solar array to 2023 usage are the ones calling me in 2026 for expansion quotes. A 200A service and a solar design with headroom are the two cheapest pieces of future-proofing in residential energy.
The Monthly Rhythm of an American Home
Annual totals hide seasonal shape, and shape matters for solar matching and battery sizing. A typical mixed-climate all-gas-heated home:
| Season | Monthly kWh (10,500/yr home) | Dominant Loads |
|---|---|---|
| Winter (Dec–Feb) | 700–800 | Lighting (long nights), water heat, furnace blower |
| Spring (Mar–May) | 650–750 | The lowest-usage quarter; mild weather |
| Summer (Jun–Aug) | 1,100–1,400 | Air conditioning dominates; pool pumps run |
| Fall (Sep–Nov) | 750–900 | AC tapering; lighting hours growing |
All-electric northern homes invert the shape — January can double July. This is why "average kW" is a poor planning number: the August peak month of a Southern home can be 1.8× its April, and a solar array sized to the annual average over-produces in spring and under-produces exactly when the AC is screaming. Net metering smooths this on an annual basis; without it, seasonal matching becomes a real design problem.
Tools That Show You Your Own Numbers
Four ways to move from national averages to your home's truth, cheapest first:
- Your utility portal. Most US utilities now expose hourly or 15-minute interval data online. Free, and good enough for everything except real-time fault-finding.
- Smart-meter manual reads. Reading the meter at the same time daily for a week costs nothing and reveals your baseline and daily totals immediately.
- Clamp-on energy monitors (the $100–250 devices that clip onto your service conductors in the panel). These show per-circuit reality and are how I find the "mystery 400W" that turns out to be a dying dehumidifier in a crawlspace.
- Plug-level monitors for individual appliances. A $20 plug meter on a refrigerator for a week answers "is this thing worth replacing" with data instead of vibes.
Fifteen minutes with the utility portal plus one week with a plug meter on the big suspects will tell you more about your home than any national average — including everything in this article.
Three Real Household Profiles
The Ramirez family, San Antonio — 2,400 sq ft, built 2005. Fourteen months of bills averaged 1,180 kWh/month (14,200 kWh/yr), July peaking at 1,900 kWh. The anatomy: a 4-ton AC from 2009 doing 45% of the annual load, electric water heater at 14%, pool pump at 12%. Their average draw was 1.6 kW but summer peaks hit 11 kW. The audit moves — a variable-speed pool pump, duct sealing, and a smart thermostat — cut 140 kWh/month before any solar discussion. Their planning numbers: 14,200 kWh for solar sizing, 11 kW peak for the 200A service they already had.
The Nguyens, Minneapolis — 1,900 sq ft, all-electric, built 2019. Cold-climate inversion: January averaged 1,650 kWh (cold-climate heat pump plus resistance backup below −10°F), July only 700. Annual total 12,800 kWh, average load 1.46 kW, winter peaks near 14 kW when the strip heat engaged. Their solar answer had to be sized annually with net metering carrying winter — a summer-matched system would have left January half-served.
Ms. Alvarez, Sacramento — 1,100 sq ft condo, gas heat. 420 kWh/month average, 5,000 kWh/year, average load just 0.58 kW, peaks of 3 kW on the hottest evenings. Her case illustrates the floor: below about 500 kWh/month, fixed utility charges and minimum bills dominate, and the conversation shifts from solar sizing to rate-plan selection and load timing. Not every efficient home needs panels first.
Three homes, three shapes, three different planning numbers — and all three started with the same fifteen-minute exercise of pulling the bills and finding the peak month. Yours will too.
The Quick-Reference Cheat Sheet
For the reader who scrolled straight here — the numbers to remember. Average US home: 10,500 kWh/year, 875 kWh/month, 29 kWh/day, 1.2 kW average load. Peak demand: 5–12 kW for most homes, sizing 100A vs 200A service decisions. Solar sizing: annual kWh ÷ (4.5 × 365 × 0.80) ≈ kW of array at national-average sun; the average home lands at 7–8 kW. Backup sizing: match the peak column, not the average — a 14–22 kW standby generator or a 10–15 kW battery inverter covers most whole-house peaks. EV ownership: add 250–350 kWh/month and a 7.2–11.5 kW evening peak. And the conversion that unlocks every bill: monthly kWh ÷ 730 = average kW; average kW × 730 = monthly kWh. Everything else in this article is detail; those six numbers are the answer.
A Note on Renters and Shared Meters
If you rent, the kW question still matters even though you cannot size a solar array. Your bill's kWh figure is your negotiating and shopping tool: it tells you whether the apartment's ancient refrigerator (verify with a plug meter) is worth raising with the landlord, whether a proposed unit's "efficient HVAC" claim survives scrutiny, and whether that spare-bedroom mining rig or aquarium heater is the villain it feels like. Master-metered buildings are the exception — no individual bill means no visibility — and asking the property manager for your unit's submeter data, where it exists, is a reasonable request that often works.
The takeaway for your own home. Every number in this article is a national average standing in for your house until you replace it. Pull the twelve bills, find the peak month, note the overnight baseline, and you will know your home's kW and kWh better than 95% of homeowners ever do — which is exactly the knowledge that turns solar quotes, generator sizing, and service upgrades from guesswork into arithmetic. Your house already knows its numbers; the meter has been recording them for years. All that remains is to read them.
Frequently Asked Questions
How many kW does the average house use at one time?
About 1.2 kW on average (10,500 kWh/year ÷ 8,760 hours), but instantaneous demand swings from a 0.2–0.4 kW overnight baseline to 5–12 kW peaks when major appliances overlap. Backup power and service panels are sized for the peak, not the average.
How many kWh does a house use per day?
The US average is about 29 kWh per day (875 kWh/month). Efficient gas-heated homes run 15–20 kWh/day; large all-electric Southern homes can hit 50–65 kWh/day in summer.
Is 10 kW a lot of power for a house?
As a momentary draw, 10 kW is a heavy-but-normal summer peak (central AC + dryer + water heater). As an average draw, 10 kW continuous would be 87,600 kWh/year — eight times the national average, commercial territory.
How many kW is a 200-amp service?
At 240V, a 200A service can deliver 48 kW maximum, with about 38 kW usable continuously under the 80% rule. Most homes on 200A service never exceed 15–20 kW of actual simultaneous demand.
How do I calculate how many kW my house uses from my bill?
Take monthly kWh and divide by 730 (hours per month) for average load in kW. For peak demand, you need a smart-meter portal, a whole-home energy monitor, or an electrician's load calculation per NEC Article 220 — the bill alone cannot show instantaneous peaks.
Related reading: Solar ROI calculator · Solar inverters · 14–17kW standby generators