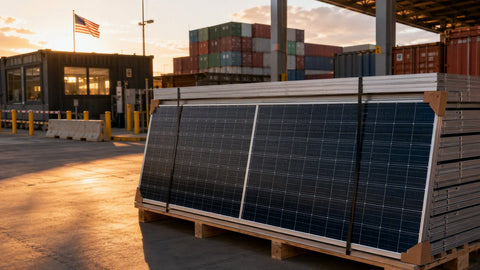
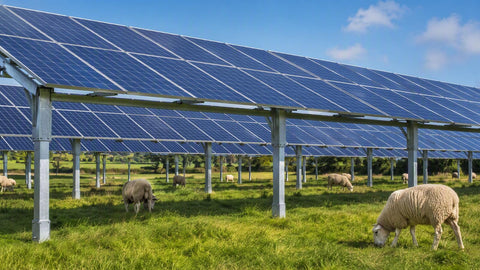
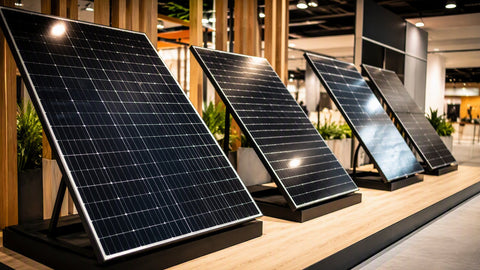
Standing on a warehouse dock stacked with 550-watt modules that cost less per watt than the pallet wrap holding them, you can feel where the solar industry is headed. Global solar PV has moved from a policy-driven niche to the single largest source of new electricity generation capacity on the planet, and the growth curve is still bending upward. This outlook pulls together the verified deployment numbers, the technology shift from PERC to TOPCon and beyond, the price collapse that changed project math forever, and the design arithmetic — NEC voltage correction, conductor sizing, degradation — that decides whether the 2025-era array you build still performs in 2050. Whether you are quoting a rooftop job or planning a commercial portfolio, these are the numbers that matter.

Key Figures — Solar PV at Mid-Decade
- ~600 GW of new solar PV capacity installed globally in 2024 — roughly five times the 2019 figure
- ~50 GWdc added in the United States in 2024, a record year led by utility-scale
- ~$0.10–0.12/W global spot module pricing in 2024, down more than 90% from 2010
- TOPCon displaced PERC as the dominant cell architecture; n-type now ships the majority of new modules
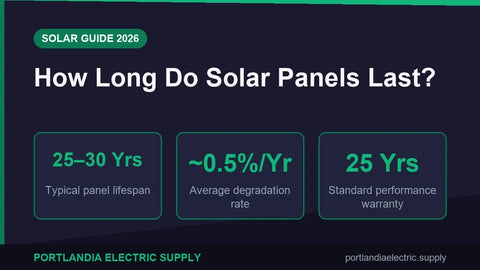
- 25–30 year warranted module lifespans at 0.40–0.55%/yr degradation — the long tail is where value compounds
Solar PV deployment has outrun every mainstream forecast made before 2020. The International Energy Agency's PV Power Systems Programme (IEA PVPS) and BloombergNEF track annual installations; the figures below reflect their published snapshots, rounded to the nearest gigawatt. Treat single-year numbers as estimates with a few percent of uncertainty — the trend is what is not in dispute.
| Year | Global PV Additions (GWdc, approx.) | Cumulative Global Capacity (TWdc) | Notes |
|---|---|---|---|
| 2019 | ~115 | ~0.63 | Pre-pandemic baseline year |
| 2020 | ~146 | ~0.77 | Supply chain shock, demand held |
| 2021 | ~191 | ~0.96 | Polysilicon price spike begins |
| 2022 | ~268 | ~1.22 | Energy crisis accelerates adoption |
| 2023 | ~446 | ~1.65 | Chinese manufacturing overcapacity wave |
| 2024 | ~597 | ~2.2 | Record year; module prices at historic lows |
Read that middle column twice: the world installed more solar in 2024 alone than existed on every roof and field on Earth in 2019. Growth of that scale changes everything downstream — racking lead times, inverter supply, interconnection queues, and the labor market for installers. For the U.S.-specific picture, the Solar Energy Industries Association (SEIA) and Wood Mackenzie put 2024 additions at roughly 50 GWdc, with this approximate segment split:
| U.S. Segment (2024) | Capacity Added (GWdc, approx.) | Share of Total |
|---|---|---|
| Utility-scale | ~41.5 | 83% |
| Residential rooftop | ~4.7 | 9% |
| Commercial (C&I) | ~2.1 | 4% |
| Community solar | ~1.7 | 3% |
| Total | ~50.0 | 100% |
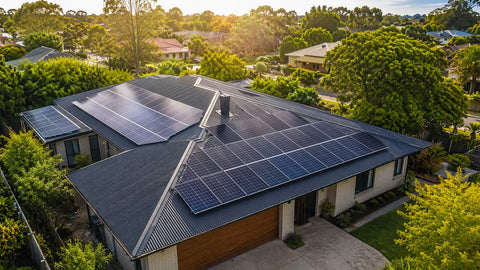
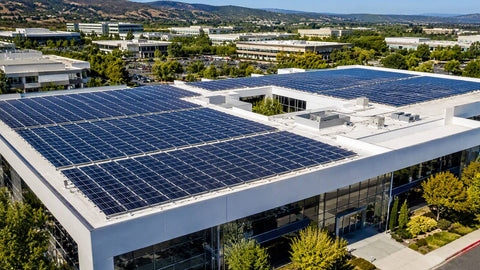
Utility-scale dominates the headline, but notice what the rooftop and commercial segments mean for equipment buyers: millions of individual systems, each one needing modules, racking, inverters, wire, and a crew that knows the code. That distributed layer is where distributors like PES Supply live — browse our solar panel collection or the 400–459W residential class to see current module pricing yourself.
No other generation technology has a learning curve like solar PV. Module prices fall as cumulative manufacturing volume doubles, and the past fifteen years produced one of the steepest cost declines in industrial history:
| Year | Typical Module Price ($/W, global) | Mainstream Module Efficiency | Dominant Cell Technology |
|---|---|---|---|
| 2010 | ~$1.80 | 14–15% | Multicrystalline Al-BSF |
| 2015 | ~$0.60 | 16–17% | Mono PERC emerging |
| 2020 | ~$0.20–0.22 | 19–21% | Mono PERC dominant |
| 2023 | ~$0.15 | 21–22.5% | TOPCon ramping |
| 2024 | ~$0.10–0.12 | 22–23.5% | TOPCon majority; HJT and back-contact premium tiers |
From 2010 to 2024 the module price fell roughly 94% while efficiency climbed about eight percentage points. I remember quoting jobs in 2016 where the modules were half the material budget; today the panel is frequently the cheapest line item on the bill of materials, and racking, labor, and permitting dominate the installed cost. That inversion is why design and balance-of-system decisions — not panel shopping — now decide project economics.
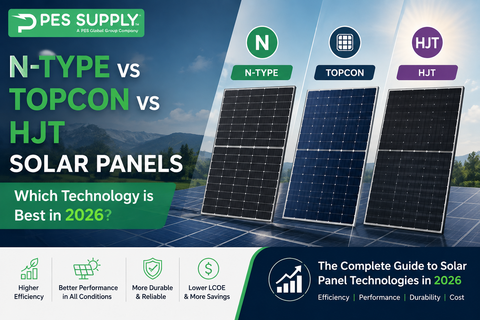
Between 2022 and 2025 the industry executed a wholesale cell-architecture transition. PERC (passivated emitter rear cell) served as the workhorse for a decade, but manufacturers converted most new capacity to TOPCon (tunnel oxide passivated contact), with heterojunction (HJT) and back-contact (xBC) designs taking the premium tier. The practical differences a buyer can feel:
- Efficiency: Mainstream TOPCon modules ship at 22–23.5% versus the 20–21% typical of late-era PERC. On a constrained roof, that is two or three extra panels' worth of production from the same square footage.
- Degradation: N-type cells largely eliminate light-induced degradation (LID) and run lower annual degradation rates — 0.40%/yr warranted on premium lines versus 0.55%/yr on standard p-type product.
- Temperature coefficient: TOPCon typically improves on PERC by about 0.05%/°C, which compounds into real energy on hot climates' rooftops.
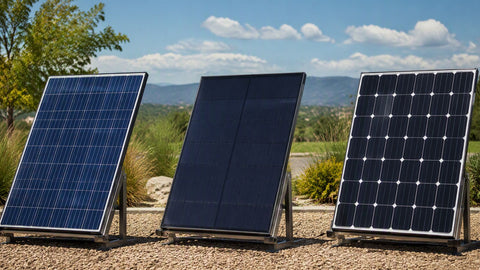
- Bifaciality: Most n-type modules are bifacial by default; on ground mounts and high-albedo surfaces the rear-side gain adds 5–15% more energy. See our bifacial solar panel collection for current options.
On the horizon, perovskite-silicon tandem cells have passed 33% efficiency in labs and are entering pilot manufacturing. Do not plan a 2025 purchase around them — bankability and 25-year field data take years to build — but expect tandem modules to appear in premium product lines late this decade.
Bigger modules with higher open-circuit voltages change the code math on every string. Two calculations I run on every design review, with real numbers:
Cold-weather voltage correction (NEC 690.7(A)). Module Voc rises as temperature falls, and string voltage must stay under the inverter's absolute maximum input. Take a modern 550W-class module with Voc = 49.8V and a site design temperature of −10°C (correction factor 1.14 from NEC Table 690.7(A)):
| Modules in String | String Voc at STC | Corrected Voc (×1.14) | Fits 1,000V Inverter Limit? |
|---|---|---|---|
| 14 | 697.2V | 794.8V | Yes — comfortable margin |
| 17 | 846.6V | 965.1V | Yes — maximum safe count |
| 18 | 896.4V | 1,021.9V | No — exceeds 1,000V |
One extra module turns a compliant design into a code violation and a firewalled inverter input. I have reviewed plans drawn in mild-climate offices that failed this check the moment they shipped to a Minnesota job site. Our panel wiring basics guide walks through string layout in more detail.
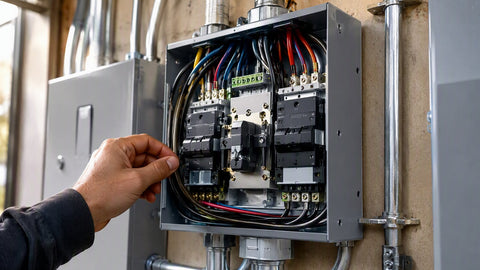
Circuit sizing (NEC 690.8 and 310.16). PV source-circuit conductors carry continuous current, so the code applies a double 125% multiplier to the string's short-circuit current. With a modern module Isc of 13.9A:
| Step | Calculation | Result |
|---|---|---|
| Maximum circuit current (690.8(A)) | 13.9A × 1.25 | 17.4A |
| Conductor ampacity floor (690.8(B), continuous) | 17.4A × 1.25 | 21.7A minimum |
| Conductor choice (310.16, 75°C copper) | 12 AWG Cu = 25A | 25A ≥ 21.7A — passes |
| Overcurrent device (240.6 standard sizes) | Next standard size above 21.7A | 25A fuse/breaker |
That 12 AWG result surprises people who remember 10 AWG as the solar default — with modern module currents and 75°C terminations, 12 AWG is frequently code-legal for single strings, though voltage drop on long runs often pushes you back to 10 AWG anyway. The full ampacity tables are in our NEC wire sizing guide.
Degradation Math: What a 2025 Array Delivers in 2050

Modules are warranted for 25–30 years, but the output at the end of that life is a math problem, not a slogan. Using the standard model — 98% of nameplate after year-one light-induced degradation, then a linear annual decline — here is what remains:
| Operating Year | Standard Module (0.55%/yr) | Premium N-Type (0.40%/yr) |
|---|---|---|
| Year 1 | 98.0% | 99.0% |
| Year 5 | 95.9% | 97.4% |
| Year 10 | 93.3% | 95.5% |
| Year 15 | 90.7% | 93.6% |
| Year 20 | 88.3% | 91.7% |
| Year 25 | 85.9% | 89.9% |
Four percentage points at year 25 sounds small until you price it: on a 400 kW commercial array producing ~560 MWh annually, the premium module's advantage is roughly 22 MWh per year at end of life — real money at any electricity price. This is why the cheapest module per watt is not always the cheapest module per kilowatt-hour.
Growth this fast creates its own friction, and any credible outlook names it:
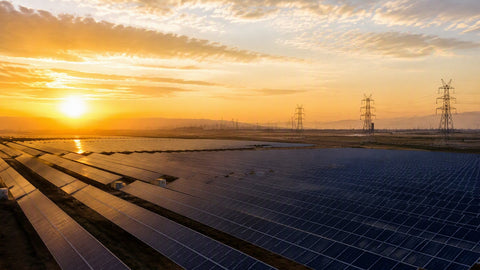
- Interconnection queues. Lawrence Berkeley National Laboratory tracks roughly 2.6 TW of generation and storage waiting in U.S. interconnection queues — multi-year waits are now the binding constraint on utility-scale growth, not module supply.
- Trade policy. Tariffs, AD/CVD cases, and domestic-content rules reshape pricing quarter to quarter. Diversified sourcing is risk management, not politics.
- Rate design. Net-metering reforms (California's NEM 3.0 being the largest) shifted residential value from export to self-consumption, pulling storage into a majority of new residential quotes in affected markets. Our battery sizing guide covers the storage side.
- Labor. The industry needs electricians faster than the trades are producing them — a constraint we feel directly as a supplier to installers.
None of these headwinds reverse the curve; they redistribute where and how fast it climbs. The IEA's medium-term scenarios put solar on a path to become the largest single source of electricity globally within the next decade, and every module-price forecast that matters expects manufacturing overcapacity to keep equipment affordable through the late 2020s. For a nearer-term pricing read, see our solar market outlook.
Three practical conclusions from the data above. First, equipment has rarely been cheaper relative to electricity prices, so the payback math on a well-designed system is as strong as it has ever been — run your own numbers with the system size calculator guide. Second, spend the savings on the parts that decide longevity: quality racking, correct wire sizing, and an inverter matched to the array rather than the budget — our inverter picks compare the current field. Third, if your roof is the constraint, high-efficiency n-type and bifacial modules earn their premium; if space is free, value-tier modules win on raw dollars per watt.
I've walked customers through three module price crashes now, and the lesson repeats: the people who bought quality equipment when prices fell were never sorry, and the people who waited for the absolute bottom usually paid more in electric bills than they saved on hardware. For commercial buyers, the same logic scales — see commercial installation costs and the commercial panel lineup. And if resiliency is part of your plan, pairing solar with storage or a properly sized standby generator covers the long outages panels alone cannot.
Module prices get the headlines, but the system's other hardware decides how much of that cheap generation actually reaches the meter. Inverters deserve particular attention in any 2025 outlook: string inverters remain the value choice for unshaded arrays, while module-level electronics (microinverters and optimizers) win where shade, complex roofs, or rapid-shutdown simplicity matter. The current field is compared in our top inverter picks, and the sizing discipline is in the string inverter sizing guide — oversizing the array 1.2–1.35× against the inverter rating remains standard practice because modules rarely produce nameplate power in the field.
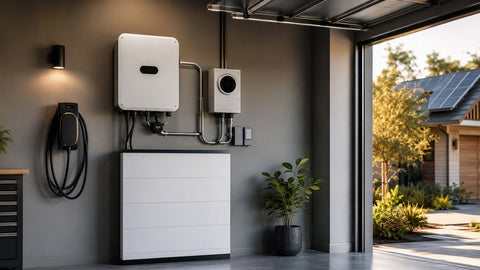
Storage is the other structural shift. Where net metering once made the grid a free battery, rate reforms in major markets now reward self-consumption, and battery attachment rates on new residential systems have climbed from a curiosity to a mainstream configuration. The sizing math — usable capacity against critical loads, not total consumption — is laid out in the battery sizing guide. Racking, finally, is the unglamorous line item where I've seen more projects go sideways than any other: cheap rails on an old roof are a leak warranty waiting to happen, and ground mounts that skip the geotechnical question become expensive lawn art after the first frost heave.
Forecasters argue about slopes, but the signposts point the same direction. The IEA's renewables analysis shows solar PV accounting for the majority of global renewable capacity growth through 2030, with total installed PV on track to roughly triple from today's ~2.2 TW level by the end of the decade in its main case. Three forces keep the curve bent upward: manufacturing capacity already built and amortized, policy frameworks (however revised) that favor electrification, and the simple fact that solar is now the cheapest new generation in most of the world by levelized cost.
The honest caveats belong in the same paragraph. Trade actions can move module prices 20–30% in a quarter. Interconnection reform decides whether utility-scale growth continues at 2024 pace or stalls behind queue studies. And rate design — the quiet killer and kingmaker of residential economics — can double or halve a market without a single panel changing hands. Anyone selling certainty about 2030 is selling something. What the data supports is this: the technology, the manufacturing base, and the economics are all in place; the variables are policy and grid access.
For buyers, that argues for a simple discipline I've repeated to customers for years: buy quality equipment when the value is there, design conservatively for the code and the climate, and don't wait for a perfect market moment that the data says isn't coming. The perfect moment was arguably 2024's price bottom — the second-best is usually now.
One more number belongs in every buyer's head: the ratio of module cost to installed cost. At today's module prices, a 10 kW residential array carries roughly $1,200–$1,500 of panel cost inside a $25,000–$30,000 installed project. That is why chasing the last two cents per watt on modules matters less than choosing the right installer, the right inverter topology, and the right financing. The equipment has never been cheaper anywhere in the industry's history; the craft around it is where the money and the risk now live.
Is solar panel growth slowing down?
No. Global installations grew from roughly 115 GW in 2019 to approximately 597 GW in 2024 — about a fivefold increase in five years. Forecasts from the IEA and BloombergNEF expect continued growth through the decade, with interconnection queues and grid capacity — not demand or module supply — as the main constraints.
How much have solar panel prices dropped?
Global module prices fell from roughly $1.80 per watt in 2010 to about $0.10–0.12 per watt in 2024 — a decline of around 94%. Over the same period, mainstream module efficiency climbed from about 14–15% to 22–23.5%.
What is TOPCon and why did it replace PERC?
TOPCon (tunnel oxide passivated contact) is an n-type cell architecture offering higher efficiency (22–23.5%), lower degradation (around 0.40%/yr warranted), better temperature coefficients, and bifacial capability compared with p-type PERC. Manufacturers converted most new production capacity to TOPCon between 2022 and 2025.
How long do modern solar panels actually last?
Modern modules carry 25–30 year performance warranties. Under the standard degradation model (98% after year one, then 0.40–0.55% per year), a panel still produces roughly 86–90% of its rated output at year 25, and arrays routinely operate productively for 30–35 years.
Will solar panels keep getting cheaper?
Manufacturing overcapacity keeps spot prices low near term, but the steepest declines are likely behind us — modules are already a minority share of installed system cost. Future savings come increasingly from efficiency gains, softer balance-of-system costs, and financing rather than hardware price drops.
Does higher module wattage mean fewer panels for the same system?
Yes, roughly in proportion. A 10 kW array needs about 25 panels at 400W but only about 18 panels at 550W. The roof area per watt shrinks more slowly than the wattage climbs, so high-wattage modules matter most when space or racking cost is the constraint.
- Solar Panel Kits Buyer's Guide
- Can Solar Panels Power a Whole House?
- Solar Panels — Full Collection
- Commercial Solar Panels
Build Your System With Today's Pricing
PES Supply stocks modules, inverters, racking, and storage from 169 authorized brands — one PO, one invoice, freight nationwide.
Get a Free Quote