Updated September 2026 — refreshed against the live PES catalog; product pricing verified 2026-09-26.
Panel direction is the single cheapest performance decision in solar: it costs nothing extra at design time and pays out every day for 30 years. Get orientation right and your array quietly outproduces the neighbor's identical system; get it wrong and no amount of premium hardware buys back the lost kilowatt-hours. This guide covers the physics of azimuth and tilt, real production numbers by compass direction, when east or west orientations actually beat south, ground-mount versus rooftop tradeoffs, and where trackers pencil out — with the math shown, not just asserted.

We design around these questions daily at Portlandia Electric Supply when we kit out solar system packages and mounting systems for installers. The rules of thumb below are the same ones our design desk uses.
The Short Answer: South, Tilted Near Your Latitude
In the Northern Hemisphere, the sun transits the southern sky, so fixed solar panels produce the most annual energy facing true south (azimuth 180°) at a tilt roughly equal to the site's latitude. That is the maximum-annual-kWh answer. But it is not always the maximum-value answer — and the difference between the two is where good design happens. Production losses for reasonable deviations are gentler than most people fear: southeast or southwest costs only about 5–8% annually, and even due east or west typically retains 80–85% of south-facing output. Before rejecting a roof, run the numbers — an east/west roof often beats a shaded south roof by a wide margin.
Why Direction and Tilt Drive Production: The Geometry
A panel's output scales with the cosine of the angle between the sun's rays and the panel's surface normal. Face the sun squarely and you harvest everything; tilt away and production falls off with that cosine. Two angles define a panel's pose: azimuth (compass direction — 180° is south) and tilt (0° is flat, 90° is vertical). The sun's path varies by latitude and season — high and long in summer, low and short in winter — so the optimal fixed pose is always a compromise between seasons. That is why latitude rules tilt: at 40°N, the sun's average noon elevation sits near 50° (90° − 40°), and a 40° tilt presents the panel squarely to that average sun.
At Portland, Oregon's latitude (~45.5°N), a perfectly south-facing, 45°-tilted array sets the annual benchmark. Here is how the alternatives compare, based on typical PVWatts-modeled results for the Pacific Northwest.
| Orientation (tilt ≈ latitude) | Annual Yield vs. South | Production Profile | Best Fit |
|---|---|---|---|
| South (180°) | 100% | Strong midday peak, balanced seasons | Maximum annual kWh |
| Southeast (135°) | ~94–96% | Morning-weighted | Morning-heavy loads |
| Southwest (225°) | ~94–96% | Afternoon-weighted | Evening peak rates, AC loads |
| East (90°) | ~82–85% | Sharp morning peak | East-only roofs, morning demand |
| West (270°) | ~82–85% | Sharp late-day peak | TOU rate arbitrage |
| North (0°) | ~55–65% | Diffuse-dominated, weak winter | Avoid when possible |
| Flat (0° tilt, any azimuth) | ~85–88% | Summer-biased, self-cleaning poor | Flat commercial roofs with ballast |
The surprise for most buyers: orientation flexibility is wide. A southwest roof at 96% of optimal beats a south-facing roof under a mature Douglas fir at 70%. Shade dominates direction in the hierarchy of losses — always solve shade first.
We installed a 10 kW array on a west-facing roof in Salem two years ago because the south face was completely shaded by a neighbor's second story. The homeowner was convinced it would not work. It produced 1,180 kWh/kW-year — 87% of what a south-facing unshaded array would have done. The shading would have killed the south face.
Matching Tilt to Latitude: The Numbers
The latitude rule gets you 95%+ of the way, but seasonal goals refine it. If you want maximum summer production (grid-tied homes banking credits, or AC-heavy loads), tilt 10–15° shallower than latitude; if you want maximum winter production (off-grid systems where December is the design constraint), tilt 10–15° steeper.
| Site Latitude | Max-Annual Tilt | Summer-Optimized Tilt | Winter-Optimized Tilt | Example Cities |
|---|---|---|---|---|
| 25°N | 25° | 10–15° | 35–40° | Miami, Houston-ish south |
| 30°N | 30° | 15–20° | 40–45° | Houston, Jacksonville |
| 35°N | 35° | 20–25° | 45–50° | Albuquerque, Raleigh |
| 40°N | 40° | 25–30° | 50–55° | Denver, Philadelphia |
| 45°N | 45° | 30–35° | 55–60° | Portland, Minneapolis |
| 50°N | 50° | 35–40° | 60–65° | Seattle-ish north, Calgary |
Two practical notes. First, most residential roofs are 18–27° pitch (4:12 to 6:12), which at mid-latitudes is shallower than "optimal" — and that is fine. The production difference between a 40° optimum and a 22° roof at 40°N is typically only 1–3% annually; flush-mounting to the existing roof is almost always the right call over tilt-up racks that add cost, wind load, and visual bulk. Second, off-grid systems should break the rule deliberately: winter sun is the binding constraint when there is no grid, so tilt steep, keep snow shedding in mind, and size conservatively. Our system size calculator and solar calculator page let you model tilt scenarios for your exact coordinates.
When East or West Beats South: The Value Argument
Annual energy is not the same as annual value. Under time-of-use (TOU) rates — now standard across California and spreading nationally — late-afternoon power can be worth two to three times midday power. A west-facing array producing 84% of maximum kWh but delivering them during $0.40/kWh evening peaks can out-earn a south-facing array selling noon power at $0.15/kWh. Run the arithmetic on a 6 kW system producing 8,400 kWh facing south versus 7,060 kWh facing west: if the south array's output averages $0.16/kWh of value and the west array's averages $0.22/kWh, the west system returns $1,553 versus $1,344 — about $210 more per year despite making 16% less energy.
Three scenarios where non-south orientations deserve a serious look:
- TOU or demand-charge exposure — west and southwest align production with expensive late-afternoon hours and with air-conditioning load itself.
- East-west dual arrays — splitting panels across an east and west roof plane flattens the production curve, reduces the midday peak (easing inverter sizing and export limits), and uses both roof planes. Combined annual yield lands around 88–92% of an all-south array, often with better self-consumption.
- Net-billing or export-limited interconnections — where exported midday power earns little, shaping production toward your own usage beats maximizing raw kWh.
I have redesigned more than one quote where the homeowner assumed the garage's west roof was "useless"; modeled against their utility's TOU schedule, it was the most valuable plane they owned.
Roof-Mount vs. Ground-Mount: Where Should Panels Go?

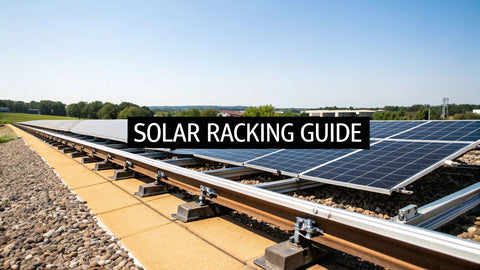
Roofs are the default because the structure already exists, but ground mounts win on orientation freedom — you choose azimuth and tilt exactly — plus cooling (better airflow behind modules adds 1–3% production), cleaning and service access, and snow-shedding geometry. The tradeoffs are cost (ground mounts typically add $0.15–$0.35/W for the structure and trenching), land use, and permitting. Ground mounts also open the door to bifacial panels, which harvest rear-side light reflected from the ground — 5–12% extra yield over bright surfaces — a gain flush rooftop panels cannot capture. If you have the space and a tough roof (wrong direction, heavy shading, structural concerns), price both options. Our racking systems guide compares the mounting families, and the 24-panel ground-mount kit shows what a complete ground-mount BOM looks like.
Row Spacing on Flat Roofs and Ground Mounts
Multi-row tilted arrays introduce inter-row shading: the front row shadows the back row when the winter sun runs low. The design rule uses the winter solstice sun. At 40°N with 20°-tilted panels, preventing shading from 9 a.m. to 3 p.m. on December 21 requires a row spacing (pitch) of roughly 2.5 times the panel's vertical height. Compress the rows to pack more panels and you trade December production for capacity — acceptable for annual-energy optimization, dangerous for off-grid winter design. Good design software resolves this per site; the point is that "tilt" on a flat roof is not free — it buys production with land.
I have climbed onto roofs in July where the surface temperature was 165°F. The modules were derating 12% from temperature alone. That is why I push clients toward modules with −0.30%/°C coefficients or better.
Solar Trackers: The Maximum-Production Option
Trackers follow the sun — single-axis (azimuth or tilt tracking, typically east-to-west) or dual-axis (full pointing). The gains are real.
| System Type | Annual Yield vs. Fixed Optimal | Added Cost | Best Use Case |
|---|---|---|---|
| Fixed, optimal tilt/azimuth | 100% (baseline) | $0 (baseline) | Most residential and commercial |
| Single-axis tracker | +15–25% | +$0.10–$0.20/W installed | Utility-scale, large ground mounts |
| Dual-axis tracker | +25–35% | Substantially higher + maintenance | Space-constrained off-grid, specialty |
The caveats decide the verdict: trackers add moving parts (motors, controllers, bearings — maintenance and failure modes), wind-load engineering, and cost. At utility scale, single-axis tracking is now the default because the math works at hundreds of acres. For residential, trackers almost never pencil out — the added cost per watt exceeds simply buying more panels, and a mechanical system on a 25-year asset introduces a service burden fixed racking does not have. In two decades around this industry, I have recommended residential trackers a handful of times, always for unusual constraints like tiny buildable footprints on off-grid homesteads. For everyone else: fixed, south-ish, unshaded, and slightly oversized wins.
Azimuth Is Only Half the Battle: Shade, Soiling, and Self-Cleaning
Tilt affects more than geometry. Panels below about 10° tilt shed water poorly, letting dirt and pollen accumulate along the bottom frame edge — a soiling pattern that can cost 3–5% beyond normal dust losses and, in worst cases, shade a full cell row. Steeper tilts self-clean with rain and shed snow faster. Orientation interacts with soiling too: a west-facing array in agricultural country collects the prevailing afternoon dust. Whatever direction you choose, a maintenance routine protects the production you designed for.
How to Find Your Optimal Direction: A Five-Step Process
- Establish true south. Use a compass corrected for magnetic declination (varies 0–20° by location) or your phone's GPS-based solar survey app. Magnetic south and true south are not the same.
- Measure roof pitch and azimuth for each candidate plane. A pitch gauge app and a satellite image get you close enough for planning.
- Audit shade hourly and seasonally. A shadow at 2 p.m. in June and one at 2 p.m. in December come from different objects. Professional shade tools (or a careful site visit at the winter solstice) prevent the worst surprise in solar.
- Model production per plane with PVWatts or your installer's design software, comparing south, southeast/southwest, and east-west splits against your rate plan.
- Optimize for value, not just kWh — match the production curve to your utility's TOU windows and your household's load shape.
For system sizing after orientation is settled, the home wattage guide and our panel catalog carry you the rest of the way.
Last spring we moved a ground-mount array from fixed tilt to seasonal adjustable for a vineyard client. He gained 8% annual production and the payback on the adjustable racking was under four years. He adjusts it himself with a wrench and a bubble level.
Seasonal Shape: How Orientation Moves Production Through the Year
Annual percentages hide the monthly story. Orientation shifts when energy arrives, which matters for off-grid design, battery sizing, and winter-shortfall planning. Modeled monthly shares for a mid-latitude site (40°N, latitude tilt):
| Period | South-Facing Share of Annual Yield | East/West Split Array Share | Steep (Latitude +15°) South Share |
|---|---|---|---|
| Jun–Aug (summer quarter) | ~32% | ~34% | ~29% |
| Sep–Nov (fall) | ~25% | ~24% | ~26% |
| Dec–Feb (winter quarter) | ~15% | ~13% | ~19% |
| Mar–May (spring) | ~28% | ~29% | ~26% |
The winter row is the one off-grid designers live in: steepening tilt by 15° lifts the winter quarter's share from about 15% to about 19% — on a 6 kW system, that is roughly 300 extra winter kWh per year, often the difference between running a generator in January and not. Grid-tied owners should read the same table in reverse: nothing about orientation rescues December, so annual net metering or a battery, not azimuth tweaks, carries you through the dark months. Our battery sizing guide picks up exactly where this leaves off for off-grid planners who need December production, not annual averages, to carry the design.
Special Cases: Carports, Awnings, and Vertical Arrays

Not every array sits on a pitched roof, and the non-standard cases follow their own logic. Carports and patio covers are ground-mount economics with built-in shade value — usually built at 5–10° tilt for drainage, facing whichever direction the driveway allows; the shallow tilt costs little at low latitudes and the dual-use structure often justifies the project by itself. Solar awnings on south-facing commercial facades double as window shading, cutting cooling load while producing power. Vertical (90°) arrays look like a mistake until you run high-latitude or snow-belt math: at 50°N, a south-facing vertical panel harvests the low winter sun almost squarely, sheds snow instantly, and can deliver 60–70% of an optimally tilted array's annual yield — with a dramatically better winter profile. Vertical bifacial fence-style arrays, running east-west and harvesting both morning and afternoon sun on opposite faces, have moved from experiment to legitimate niche for agricultural land that must stay in production. None of these replace a good south roof — but they regularly rescue sites that conventional wisdom writes off, which is why we keep the full mounting catalog on hand for the odd geometries.
Orientation and System Economics: The Payback Angle
Direction decisions ripple through project economics in ways a simple kWh count misses. Consider an 8 kW array where the south roof fits 5 kW and the west roof fits 3 kW. The blended system yields roughly 96% of an all-south build — a trivial energy penalty — but the west portion's late-afternoon production aligns with peak TOU rates and household consumption, often lifting self-consumed share by 8–12 points versus an all-south system that floods the grid at noon under a net-billing tariff. On a typical West Coast rate plan, that shift can be worth $80–$150 per year, every year. The same logic scales commercially: C&I designers increasingly orient arrays to flatten the production curve against demand charges and export limits rather than chase maximum noon output. Direction, in other words, is a tariff strategy as much as a geometry problem — and the installer who asks for your rate schedule before recommending a layout is the one doing it right. Model the scenarios on our ROI calculator with your actual utility plan to see how much the answer moves.
Putting It Together: A Worked Site Example
Pull the pieces together on a realistic house: a 2,400 sq ft home at 42°N with a 24°-pitch gable roof running east-west, one mature oak shading the west plane after 3 p.m. in winter, on a TOU rate where 4–9 p.m. power costs triple the midday rate. The naive design says "south is best, this roof has no south, no solar." The engineered design splits 14 × 450 W panels: nine on the east plane (morning production, unshaded all year), five on the west plane north of the oak's shadow line (late-day production into the peak window), latitude-minus tilt left flush at 24° because tilt-up racking would buy 2% at the cost of wind exposure and curb appeal. Modeled annual yield lands around 88% of a hypothetical perfect south array — but modeled annual value lands within 2–3% of it, because production lands in expensive hours. That is the entire orientation discipline in one example: geometry sets the energy ceiling, shade sets the real ceiling, and the rate plan decides what the result is worth. Panels for either plane come from the same catalog — browse 450 W class modules or the broader panel lineup once the layout is settled — the current residential line runs 440–470W and large-format 580–640W (prices verified 2026-09-26).
Orientation Strategy for Battery-Coupled Systems
Add storage and the orientation calculus shifts again, in ways most design guides ignore entirely. A battery decouples production timing from consumption timing, which partially rehabilitates south-facing midday surplus — excess noon power gets stored instead of exported at pennies. But it does not change the physics that a flattened production curve charges a battery more reliably across the day and leaves less energy stranded when the battery hits full by 1 p.m. For off-grid systems, where the battery is the grid, east-west splits genuinely shine: morning production starts recharging before breakfast loads are done, and evening production stretches the battery's overnight margin. Design those systems winter-first, tilt steep, and size storage from the December production number, not the annual average — the off-grid battery sizing guide walks that math step by step.
Frequently Asked Questions
What is the best direction for solar panels in the US?
True south at a tilt near your latitude maximizes annual energy for essentially all US locations. Southeast and southwest lose only about 4–6%, and even east or west retains 80–85% of south-facing output — close enough that rate plans, shade, and roof geometry often flip the best-value answer away from due south.
Are east- or west-facing solar panels worth it?
Yes, in the right conditions. Under time-of-use rates, west-facing panels produce during expensive late-afternoon hours and can out-earn a larger south-facing array. East-west split arrays flatten the production curve and improve self-consumption. The 15–18% energy penalty is often smaller than the value gain.
What angle should solar panels be tilted at?
Set tilt equal to your latitude for maximum annual production: about 30° in Houston, 40° in Denver, 45° in Portland. For summer-weighted production go 10–15° shallower; for winter-critical off-grid systems go 10–15° steeper. On existing roofs, flush-mounting to the roof pitch usually costs you only 1–3% versus the theoretical optimum.
Can I put solar panels on a north-facing roof?
Technically yes, but expect only 55–65% of south-facing production in the continental US — rarely economical unless the site is very far south or the alternative is no solar. Better options: ground mounts, carports, or using east/west planes. If north is truly all you have, model it honestly before committing.
Do solar panels work if they are not facing the sun directly?
Yes — panels harvest diffuse light and angled direct light, losing production with the cosine of the incidence angle. That is why orientation penalties are gentler than intuition suggests: an east-facing panel at solar noon is still collecting substantial energy, just not its peak.
How much does panel direction really affect production?
South to southeast/southwest: roughly 4–6% annually. South to due east/west: roughly 15–18%. South to flat: roughly 12–15%. South to north: 35–45%. Shade from trees or buildings routinely exceeds all of these — solve shade before agonizing over azimuth.
Design Once, Harvest for Decades

Orientation is a one-time decision with a thirty-year payoff. Start with true south at latitude tilt, then let shade reality, rate plans, and roof geometry refine the answer — and remember that a good west-facing array beats a perfect south-facing design that never gets built because the roof "wasn't ideal." When you are ready to turn angles into equipment, our team kits complete systems with the panels, racking, and inverters matched to your design — start the conversation through our contact page or the solar installation guide.
Seasonal Tilt Adjustment: When Tracking Is Not an Option
For ground-mount arrays with adjustable racking, seasonal tilt changes capture 5–10% more annual energy than a fixed tilt set at latitude. The rule is simple: tilt at latitude minus 15° in summer, latitude plus 15° in winter, and latitude in spring and fall. The adjustment takes two people about 30 minutes on a standard residential ground mount.
| Location (Latitude) | Winter Tilt | Spring/Fall Tilt | Summer Tilt | Annual Gain vs. Fixed |
|---|---|---|---|---|
| Miami, FL (26°N) | 41° | 26° | 11° | +5.2% |
| Portland, OR (46°N) | 61° | 46° | 31° | +8.1% |
| Denver, CO (40°N) | 55° | 40° | 25° | +7.4% |
| Minneapolis, MN (45°N) | 60° | 45° | 30° | +8.6% |
| Phoenix, AZ (33°N) | 48° | 33° | 18° | +6.3% |
The gain is highest at higher latitudes where the seasonal sun path variation is greatest. In Portland, where winter solar altitude at noon drops to 21°, a 61° tilt captures significantly more December energy than a fixed 46° tilt. We specify adjustable racking for off-grid cabins and agricultural pumps where every watt-hour matters. For grid-tied residential systems, the labor of four annual adjustments usually does not justify the gain unless the homeowner is mechanically inclined.
Shading Analysis: Why Direction Matters Less Than You Think
We have surveyed hundreds of residential roofs. The number one production killer is not suboptimal azimuth — it is shading. A single dormer shadow across a south-facing array at 10 AM can cost more annual energy than pointing the entire array 30° off south with zero shading.
The mathematics are brutal. A shadow covering just 5% of a module's surface area can reduce that module's output by 30–50% if the module has no bypass diodes or if the shading pattern activates only one diode. Modern half-cell modules with three bypass diodes mitigate this, but partial shading still produces disproportionate losses. Before finalizing array orientation, run a shading analysis with a Solar Pathfinder, drone photogrammetry, or at minimum a site survey at 9 AM, noon, and 3 PM on the winter solstice.
| Shading Source | Typical Daily Loss | Seasonal Variation | Solution |
|---|---|---|---|
| Chimney (small, partial) | 2–5% | Winter mornings | Microinverters or optimizers |
| Dormer (medium, partial) | 5–12% | Year-round, morning or afternoon | Module-level electronics or layout adjustment |
| Tree (large, moving) | 10–40% | Growing season, mornings | Trimming, panel relocation, or ground mount |
| Adjacent building | 15–60% | Year-round, fixed hours | Taller mounting, different roof face, or ground mount |
| HVAC equipment | 3–8% | Year-round, midday | Relocate equipment or raise array above it |
On a job in Lake Oswego last year, the south-facing roof had a beautiful 35° pitch but was shaded by a mature oak from 2 PM onward from May through October. We moved the array to the west-facing garage roof at 22° pitch with zero shading. Annual production increased 14% despite the worse orientation. Direction is a variable. Shading is a veto.
Tracker Economics: Single-Axis vs. Fixed Tilt
For ground-mount systems larger than 10 kW, single-axis trackers can increase annual production by 20–30% compared to fixed tilt. The economics depend on land cost, tracker cost, and local irradiance. A residential-scale single-axis tracker adds $0.40–$0.80 per watt to system cost. At Portland's 1,350 kWh/kW-year, a 20% gain is 270 kWh annually per kW, worth $46/year at $0.17/kWh. The tracker premium pays back in 7–15 years — viable for off-grid systems with limited roof space, less compelling for grid-tied residential.
| System Type | Cost Adder | Production Gain | Simple Payback (Portland) | Simple Payback (Phoenix) |
|---|---|---|---|---|
| Fixed tilt ground mount | Baseline | Baseline | N/A (baseline) | N/A (baseline) |
| Single-axis tracker | $0.50/W | +25% | 12 years | 7 years |
| Dual-axis tracker | $0.90/W | +30% | 16 years | 9 years |
| East-west fixed (low tilt) | −$0.05/W | −5% | N/A (lower cost) | N/A (lower cost) |
We specify trackers for agricultural irrigation systems where the land is already dedicated to the array and the load profile matches daytime production. For residential grid-tied systems, a well-oriented fixed array with quality modules almost always wins on lifetime ROI.
Frequently Asked Questions
How to Calculate Optimal Solar Panel Tilt and Azimuth
- Determine your latitude. Use GPS or online maps. This is your baseline tilt.
- Adjust for season. For year-round, set tilt equal to latitude. Summer: subtract 15°. Winter: add 15°.
- Measure roof azimuth. True south is 180° in the Northern Hemisphere.
- Run production modeling. Use PVWatts to compare annual kWh for your actual orientation.
- Evaluate shading. Even perfect azimuth loses to shade. Use Solar Pathfinder or drone analysis.