2022 Solar Industry Retrospective: IRA Passage, Supply Chain Crisis, and Market Transformation
20.2 GWdc installed. $369 billion in new federal climate spending. 2 GW of modules detained at the border. Polysilicon at nearly $40 per kilogram. Those four figures define the U.S. solar industry's 2022 calendar year. This almanac-style record lays out the year month by month and number by number: equipment price levels by month, capacity additions by segment, the credit mechanics of the Inflation Reduction Act with section numbers and effective dates, and the supply-chain cost movements that fed into installer quotes from January through December. For distributors like PES Supply — which stocks 50,000+ SKUs across 169 authorized brands — 2022 was a year of rerouting shipments, requoting projects, and tracking weekly price sheets. This retrospective records what happened and what the data showed heading into 2023.
Equipment to consider: browse current solar panels, solar inverters, and batteries and energy storage from PES Supply's 50,000+ SKUs across 169 authorized brands.
2022 by the Numbers
The headline statistics for calendar year 2022, drawn from the SEIA/Wood Mackenzie U.S. Solar Market Insight 2022 Year in Review, the Solar Foundation's National Solar Jobs Census, and U.S. Customs and Border Protection reporting:
| Metric | 2022 Value | Change vs. 2021 |
|---|---|---|
| Total U.S. solar installations | 20.2 GWdc | -16% |
| Residential installations | 5.9 GWdc | +40% (record) |
| Solar share of new U.S. generating capacity | 50% | 4th consecutive year at #1 |
| Grid battery storage additions | ~4.8 GW / ~12.2 GWh | +62% / +80% (approx.) |
| U.S. solar workforce | 263,883 workers | +3.5% |
| Domestic module manufacturing capacity | ~9 GW (1.8 GW added) | +25% |
| Modules detained under UFLPA | >2 GW (1,423 shipments, ~$709.9M) | New enforcement regime |
| Single-family owner-occupied homes with solar | 6% | +~1 percentage point |
Month-by-Month Timeline of 2022
2022's policy and supply events arrived in a compressed sequence. The table below records the dated events that moved pricing and availability during the year.
| Date (2022) | Event | Market Effect |
|---|---|---|
| February 4 | Section 201 safeguard tariffs extended four years; cell quota doubled to 5 GW; bifacial exemption retained | Tariff certainty on cells; module pricing premium persists |
| February 8 | Auxin Solar files AD/CVD circumvention petition covering Cambodia, Malaysia, Thailand, Vietnam | Procurement freeze risk enters utility-scale segment |
| March 28 | Commerce Department acknowledges petition; preliminary inquiry begins | Southeast Asian module suppliers pause new U.S. contracts |
| April 1 | Commerce formally initiates circumvention investigation (Federal Register) | Retroactive duty risk estimated at up to 50-250% on affected imports |
| June 6 | President Biden invokes Section 318(a) of the Tariff Act: 24-month moratorium on new duties from the four countries | Module ordering resumes; spot availability stays tight |
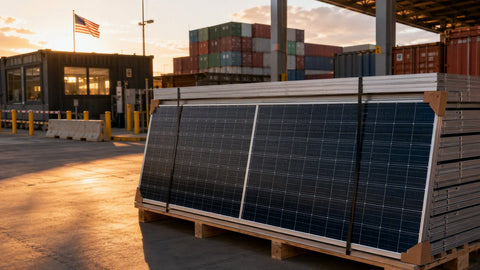
| June 21 | UFLPA rebuttable presumption takes full effect | CBP begins detaining module shipments; >2 GW held by year-end |
| July 27 | Schumer-Manchin agreement revives climate bill as the Inflation Reduction Act | ITC extension back on the table after months of uncertainty |
| August 7 / August 12 | Senate passes IRA 51-50; House passes 220-207 | Final text confirmed: 30% ITC, storage ITC, manufacturing credits |
| August 16 | IRA signed into law | Section 25D 30% credit retroactive to January 1, 2022 |
| October-November | Polysilicon holds near $39-40/kg peak; first price relief signals appear in China spot market | Buyers delay orders in anticipation of 2023 declines |
| December 1 | ROTH Capital reports first meaningful UFLPA releases, including JinkoSolar modules with Wacker polysilicon | Detained inventory begins clearing |
| December 2 | Commerce preliminary determination: four of eight investigated companies found circumventing AD/CVD orders | Exposure capped by June moratorium; 2024 cliff deferred |
| December | Polysilicon spot falls sharply from ~$39/kg toward ~$25/kg | Module price decline begins, accelerating into Q1 2023 |
Equipment and Input Prices by Month
Module pricing in 2022 moved opposite to the long-run trend. After roughly a decade of near-continuous cost decline, U.S. module prices rose during 2022 as polysilicon, freight, tariffs, and detention risk compounded. The table below records approximate monthly price levels: polysilicon spot (Bernreuter/EnergyTrend ranges), global mono PERC module spot (PVInsights/InfoLink ranges), indicative U.S. landed module pricing, and the Drewry composite container freight benchmark for the Shanghai-Los Angeles lane. Figures are rounded approximations for almanac reference, not transactional quotes.
| Month (2022) | Polysilicon ($/kg) | Global Module Spot ($/W) | U.S. Landed Module ($/W, approx.) | Container Freight, Shanghai-LA ($/FEU) |
|---|---|---|---|---|
| January | 27-30 | 0.25-0.26 | 0.34-0.36 | ~9,700 |
| February | 28-31 | 0.25-0.26 | 0.35-0.37 | ~9,300 |
| March | 30-32 | 0.26-0.27 | 0.36-0.38 | ~8,800 |
| April | 32-34 | 0.26-0.27 | 0.37-0.40 | ~7,900 |
| May | 34-36 | 0.27-0.28 | 0.38-0.41 | ~8,600 |
| June | 36-38 | 0.27-0.28 | 0.39-0.42 | ~8,400 |
| July | 38-40 | 0.27-0.28 | 0.40-0.43 | ~7,900 |
| August | 38-40 | 0.27-0.28 | 0.41-0.44 | ~6,600 |
| September | 38-40 | 0.26-0.27 | 0.41-0.44 | ~5,400 |
| October | 38-39 | 0.25-0.26 | 0.41-0.44 | ~3,800 |
| November | 36-39 | 0.24-0.25 | 0.41-0.45 | ~2,900 |
| December | 25-35 (falling) | 0.22-0.24 | 0.40-0.45 | ~2,100 |
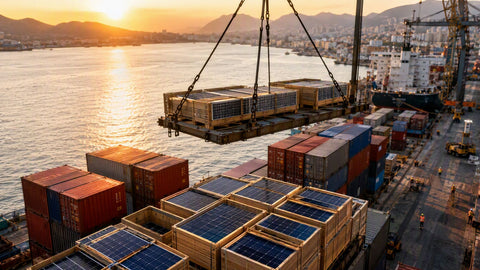
Three observations follow from the monthly data. First, polysilicon rose roughly 40% from January to its August-November plateau near $39-40/kg, driven by demand growth outpacing new refining capacity and energy-curtailment disruptions at Chinese plants. Second, freight moved the other way: the Shanghai-Los Angeles container rate fell roughly 78% from January to December as pandemic-era congestion unwound, partially offsetting the polysilicon increase in landed cost. Third, the U.S. landed module price rose through the entire year despite both of those inputs turning favorable in Q4 — evidence that UFLPA detention risk and tariff structure, not just commodity cost, set the U.S. price floor in 2022. Buyers comparing current monocrystalline panels or bifacial panels with 2022 quotes will recognize how abnormal that year's price action was.
The Inflation Reduction Act: Credit Mechanics, Section by Section
The Inflation Reduction Act was signed on August 16, 2022, directing roughly $369 billion toward energy security and climate programs (Earthjustice; SEIA IRA Summary). The table below records the mechanics of the provisions most relevant to solar and storage buyers: Internal Revenue Code section, credit value, and effective date.
| IRC Section | Provision | Credit Value | Effective Date |
|---|---|---|---|
| §25D | Residential Clean Energy Credit | 30% of installed cost (was scheduled to fall to 26% in 2022 and 22% in 2023) | Retroactive to January 1, 2022; 30% through 2032, then 26% in 2033, 22% in 2034 |
| §48 | Investment Tax Credit (commercial) | 6% base rate, raised to 30% for projects meeting prevailing-wage and apprenticeship requirements | Projects beginning construction after enactment; holds through at least 2032 |
| §48(a)(3)(A)(ix) / §48E | Standalone energy storage ITC | 30% for storage ≥5 kWh (commercial) and ≥3 kWh (residential), no solar pairing required | January 1, 2023 |
| §45 | Production Tax Credit (revived solar option) | 2.6¢/kWh (2022 inflation-adjusted full rate with wage/apprentice compliance; 0.5¢ base) | Facilities beginning construction before 2033 |
| §45X | Advanced Manufacturing Production Credit | $0.07/Wdc module, $0.04/Wdc cell, $12/m² wafer, $3/kg polysilicon, plus credits for trackers, inverters, and battery components | Components produced and sold after December 31, 2022 |
| §48C | Qualifying Advanced Energy Project Credit | 30% for manufacturing and recycling facilities; $10B allocation, $4B reserved for energy communities | First allocation round opened 2023 |
| §45(b)(9) / §48(a)(14) | Domestic content bonus | +10 percentage points (ITC) or +10% (PTC) | Projects placed in service after 2022 |
| §45(b)(11) / §48(a)(15) | Energy community bonus | +10 percentage points (ITC) or +10% (PTC) | Projects placed in service after 2022 |
| §48(e) | Low-income community bonus | +10 or +20 percentage points for qualifying facilities under 5 MWac | Allocation program opened 2023 |
| §6417 / §6418 | Direct pay and credit transferability | Tax-exempt entities receive credits as refunds; credits sellable for cash | Taxable years beginning after December 31, 2022 |
The practical arithmetic for buyers: a $30,000 residential system installed in 2022 carried a $9,000 federal credit under §25D rather than the $7,800 that the pre-IRA 26% schedule would have produced, and the retroactivity meant systems installed as early as January 2022 qualified for the full 30%. On the commercial side, the 30% §48 rate with wage and apprenticeship compliance — plus stacking bonuses of up to +20 points for domestic content and energy communities, and +10 to +20 points for low-income siting — pushed effective credits toward 50-60% of eligible cost for well-structured projects. State-level stacking further changes project math; our solar incentives by state reference tracks the non-federal side. The decade-long runway also changed procurement behavior: multi-year supply agreements for U.S.-made solar panels began pricing the §45X production credits into forward quotes during Q4 2022.
Supply-Chain Price Effects: The Cost Stack Behind 2022 Quotes
System pricing in 2022 reflected a full cost stack, not modules alone. The table below records the major input movements across the year.
| Input | 2021 Level | 2022 Level / Peak | Direction |
|---|---|---|---|
| Polysilicon | ~$23/kg average | ~$34/kg average; ~$39-40/kg August-November peak | Up ~40% Jan→peak |
| Container freight (Shanghai-LA) | ~$11,000/FEU peak (2021) | ~$9,700/FEU January → ~$2,100/FEU December | Down ~78% within 2022 |
| U.S. residential retail electricity | 13.72¢/kWh average | 15.12¢/kWh average (EIA) | +10.2% |
| Henry Hub natural gas | $3.89/MMBtu average | $6.42/MMBtu average | +65% |
| Lithium carbonate (battery grade) | ~$18,000/t early 2021 | ~$70,000+/t November 2022 peak | Roughly tripled year over year |
| U.S. CPI (all items) | 4.7% average | 8.0% average; 9.1% June peak | 40-year high |
| Residential PV system price | ~$3.25/W | ~$3.40/W (Wood Mackenzie) | +~5% |
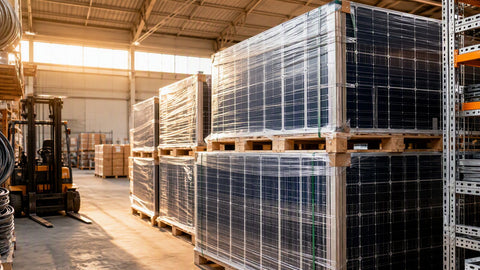
The mix mattered by segment. Residential system prices rose only about 5% because roughly half the segment's modules were domestically produced or pre-positioned, and because freight — a shrinking line item by Q4 — weighs less on truck-delivered residential volume. Utility-scale pricing moved far more: fixed-tilt utility systems rose roughly 10-15% on some trackers and modules repriced mid-contract, and developers absorbed detention-related carrying costs that did not appear in any index. Battery pricing ran counter to the IRA's storage incentives all year: lithium carbonate near $70,000/t pushed cell costs up even as the new §48 standalone storage credit, effective January 1, 2023, promised to recover 30% of installed cost. Installers planning LiFePO4 battery procurement watched both curves at once. Balance-of-system costs — racking and mounting, PV wire and cable, switchgear — tracked steel, aluminum, and copper plus general 8% CPI inflation, and lead times on transformers and switchgear began stretching into 2023.
Capacity Additions: A 16% Contraction With a Record Residential Segment
Between UFLPA detentions, the circumvention investigation, and cost pressure, the U.S. market installed 20.2 GWdc in 2022, down 16% from 2021's 23.6 GWdc (SEIA; Wood Mackenzie). The contraction was uneven across segments:
| Segment | 2022 Installed Capacity | Change vs. 2021 |
|---|---|---|
| Utility-scale | 11.8 GWdc | -31% |
| Residential | 5.9 GWdc | +40% (record) |
| Commercial | ~1.7 GWdc | -6% |
| Community solar | ~1.0 GWdc | -16% |
| Total U.S. market | 20.2 GWdc | -16% |
Utility-scale absorbed the entire contraction: the segment fell 31% because its procurement model — large module orders placed 6-18 months ahead, mostly from Southeast Asian fabs — sat directly in the path of both the Auxin investigation and UFLPA enforcement. Residential set a record at 5.9 GWdc, up 40%, insulated by domestic module supply and pulled forward by electricity rates up 10.2% on average. Even in a down year, solar supplied 50% of all new U.S. generating capacity, the fourth consecutive year it led all technologies. Grid storage added roughly 4.8 GW and 12.2 GWh, and domestic module manufacturing capacity grew about 25% to roughly 9 GW as the first §45X-driven announcements converted to construction.
Trade Policy: Section 201, UFLPA, and the Auxin Case
Three separate trade regimes operated simultaneously in 2022, and each had a measurable price effect. The Section 201 safeguard extension of February 4 kept a 14.75% tariff on imported cells and modules in its first extension year (declining 0.25 percentage points annually), while doubling the tariff-free cell quota to 5 GW and keeping bifacial modules exempt (USTR). UFLPA, effective June 21, produced the year's largest physical disruption: more than 2 GW of modules across 1,423 shipments worth roughly $709.9 million were detained under the rebuttable presumption, with detentions peaking in Q3 and the first documented releases — including JinkoSolar modules built on Wacker polysilicon — reported by ROTH Capital in early December (PV Tech; pv magazine USA). The Auxin AD/CVD case ran on its own calendar: petition February 8, Commerce initiation April 1, the June 6 presidential moratorium suspending new duties for 24 months, and a December 2 preliminary determination finding four of eight investigated companies circumventing (Federal Register). Buyers sourcing from brands such as Qcells or LONGi saw availability swing week to week as each docket moved.
State Policy: California NEM 3.0 Landed in December
Federal policy was not the only 2022 record entry. On December 15, 2022, the California Public Utilities Commission unanimously approved the Net Billing Tariff — NEM 3.0 — replacing retail-rate net metering for new residential applicants with an avoided-cost export rate that cut average export compensation by roughly 75%. The decision applied to new interconnection applications filed after April 14, 2023, which produced a documented Q1 2023 rush of NEM 2.0 applications and an immediate shift in system design economics: self-consumption with storage replaced grid export as the value driver, and residential battery attach rates in California climbed from roughly 10% toward a majority of new installs within two years. Other states watched the proceeding closely; net metering reform dockets were active in more than a dozen states during 2022, and the California outcome became the reference case for how export-rate reductions redirect demand toward storage rather than suppressing it outright.
Notes From the Field
Almanacs record numbers; crews lived the scheduling. I requoted one 40 kW commercial job three times between April and September 2022 because the module price moved between the bid date and the rerelease date each time. My warehouse ran leaner than at any point in my career — we stocked string inverters and microinverters to depth but kept module inventory shallow because holding panels through a falling December market meant writing down cost basis. On my residential crews, we shifted to confirmed-stock ordering in the second half of the year: no proposal went out until a distributor confirmed the specific module wattage class was physically available, and I wrote 10-day price-validity windows into every contract after August. I also started quoting storage on every residential proposal after the December NEM 3.0 decision, because my California-facing customers asked about batteries on nearly every call in the final two weeks of the year. Those habits carried into 2023.
Heading Into 2023
Wood Mackenzie initially forecast supply constraints persisting through 2023 with installations recovering about 41% to roughly 28.4 GW; the market ultimately grew 51% to 32.4 GWdc as polysilicon collapsed toward $10/kg and module prices fell below $0.30/W globally (SEIA 2023 Year in Review). The December 2022 polysilicon break visible in the monthly table was the leading edge of that move: new refining capacity in China roughly doubled effective supply during 2023, and the cost decline propagated through wafers, cells, and modules over the following four quarters.
In retrospect, 2022 locked in the policy framework — a 30% ITC through 2032, storage credits, manufacturing credits, and bonus stacking — while the supply chain absorbed the year's disruptions and began clearing by December. Every element of the cost stack that had moved against buyers during the year, from polysilicon to freight to detention risk, reversed within the following twelve months, while the credit mechanics put in place on August 16 remained fixed. That asymmetry — temporary cost inflation paired with permanent credit expansion — is the core entry in the 2022 record, and it explains why an installation year that contracted 16% set up the largest growth years in the industry's history.
Key Takeaways for 2022
- The IRA was signed August 16, 2022: §25D restored to 30% retroactive to January 1, 2022; §48 at 30% with wage/apprentice compliance; standalone storage ITC effective January 1, 2023; §45X manufacturing credits for production after December 31, 2022 (SEIA).
- UFLPA detentions exceeded 2 GW of modules — 1,423 shipments, ~$709.9 million — with releases beginning in December 2022 (PV Tech).
- Polysilicon peaked near $39-40/kg from August through November before falling sharply in December; U.S. landed module prices rose all year regardless.
- The market contracted 16% to 20.2 GWdc while residential grew a record 40% and solar supplied 50% of new grid capacity (SEIA).
- Section 201 tariffs extended four years at 14.75% initial rate; the Auxin AD/CVD case produced a December 2 preliminary circumvention finding, capped by a 24-month duty moratorium.
Frequently Asked Questions
How much solar capacity did the U.S. install in 2022?
20.2 GWdc, a 16% decline from 2021's 23.6 GWdc, according to the SEIA/Wood Mackenzie U.S. Solar Market Insight 2022 Year in Review. Utility-scale fell 31% to 11.8 GWdc while residential set a record at 5.9 GWdc, up 40%.
When did the Inflation Reduction Act take effect for solar?
The IRA was signed August 16, 2022. The §25D residential credit rose to 30% retroactive to January 1, 2022; the §48 commercial ITC moved to 30% for qualifying projects; the standalone storage credit and §45X manufacturing credits took effect January 1, 2023.
How much solar equipment was detained under UFLPA in 2022?
U.S. Customs and Border Protection detained more than 2 GW of solar modules — about 1,423 shipments valued near $709.9 million — after the rebuttable presumption took effect June 21, 2022. Documented releases began in December 2022.
Did solar panel prices rise or fall in 2022?
U.S. landed module prices rose through the year, from roughly $0.34-0.36/W in January to roughly $0.40-0.45/W in December, even as polysilicon fell sharply in December and freight dropped about 78% within the year. Tariff and detention risk held the U.S. price floor.
Is the 30% residential solar tax credit retroactive for 2022 installs?
Yes. Section 25D applies at 30% to systems installed from January 1, 2022 onward, remains 30% through 2032, then steps to 26% in 2033 and 22% in 2034.
What was the outcome of the Auxin Solar AD/CVD investigation in 2022?
Commerce initiated the circumvention inquiry April 1, 2022, and issued a preliminary determination on December 2, 2022 finding four of eight investigated companies circumventing. A June 6, 2022 presidential action under Section 318(a) of the Tariff Act suspended new duties on the four Southeast Asian countries for 24 months.
For help sourcing solar, storage, and electrical equipment through continued supply chain volatility, explore PES Supply's full solar equipment catalog, our solar panel kits buyer's guide, and current commercial solar installation cost benchmarks, or reach out to our team about current brand availability.
🛒 Shop This Article
Find the equipment mentioned in this article across our 50,000+ SKUs from 169 authorized brands. 7-10 business days delivery.