Last Updated: 2026 • Production data from NREL PVWatts methodology and field monitoring across PES Supply customer systems

Every homeowner asks the same question after the panels go up: "Why is my system making less power today than yesterday?" Nine times out of ten the answer is weather — and it's rarely the weather factor they expect. Clouds matter, obviously. But temperature matters more than most people realize, snow matters less than they fear, and rain is quietly doing them a favor.
The stakes are not trivial. A system financed on a 25-year production model lives or dies on whether the weather assumptions inside that model match the roof it sits on. Understanding the physics below is how you hold installers, models, and your own expectations to an honest standard.
We monitor production data from customer systems across climate zones, and the patterns are consistent enough to plan around. This guide breaks down exactly how each weather element — irradiance, temperature, cloud cover, rain, wind, snow, and season — moves your kilowatt-hours, with the actual math you can use to set honest expectations for any array in any zip code.
⚡ Quick Answer
Weather moves solar production through four main channels: sunlight availability (clouds can cut output 10–90% depending on density), cell temperature (panels lose roughly 0.25–0.40% of power per °C above 25°C — cold sunny days are the best producers), soiling and cleaning (rain washes panels; dusty dry spells cost 2–5% annually), and season (mid-latitude arrays typically produce 1.5–2× more in June than December). Annual energy matters more than any single day, and well-sited US arrays deliver within ±10% of modeled estimates most years.
Solar panels convert irradiance — the sunlight actually arriving at the glass — into DC power roughly in proportion. Cut the irradiance in half and you cut the power roughly in half. Clouds are simply irradiance filters, and their effect scales with density:
| Sky Condition | Typical Output vs. Clear Sky | What's Happening |
|---|---|---|
| Clear, full sun | 100% | Direct beam dominates; panels track nameplate against temperature |
| Thin / high cloud (cirrus) | 75–90% | Beam scattered, but most energy still arrives |
| Broken cloud | 40–80%, swinging minute to minute | Production follows each cloud shadow across the array |
| Overcast, uniform grey | 10–25% | Diffuse light only — panels still produce, just modestly |
| Heavy storm cloud | 5–10% | Minimal irradiance; treat as a near-zero production window |
Two counterintuitive details worth knowing. First, panels do produce on overcast days — diffuse light is still light, and a modern module keeps converting at 10–25% of rated output under full cloud. Second, the edge-of-cloud effect is real: when the sun emerges at a cloud edge, lensing and reflection can briefly push irradiance above clear-sky levels, spiking output past nameplate for seconds at a time. If your monitoring shows a 9 kW peak on an 8.2 kW array, that's not a fault — that's cloud-edge enhancement doing its party trick.
Here is the single most misunderstood fact in residential solar: panels like cold, not heat. Solar module power is rated at a cell temperature of 25°C (77°F) — and for every degree the cell runs above that, power falls by the module's temperature coefficient. The coefficient varies by cell technology, and it's printed on every datasheet:
| Cell Technology | Typical Pmax Temp Coefficient | Power at 65°C Cell Temp (vs. 25°C rating) |
|---|---|---|
| Mono PERC | −0.34 to −0.40 %/°C | −13.6 to −16.0% |
| N-type TOPCon | −0.29 to −0.30 %/°C | −11.6 to −12.0% |
| HJT (heterojunction) | −0.24 to −0.26 %/°C | −9.6 to −10.4% |
| Thin-film (CdTe) | −0.20 to −0.28 %/°C | −8.0 to −11.2% |
Cell temperature runs 25–35°C above ambient on a still, sunny day — that's the physics of a dark glass surface absorbing sunlight. So a 35°C (95°F) summer afternoon means cell temperatures around 60–70°C, and a PERC module is giving back 12–16% of its nameplate power to heat at the exact moment the sun is strongest. This is why desert sites never quite deliver what their irradiance maps promise, and why a crisp 10°C bluebird day in April can out-produce a July scorcher hour for hour.
Worked Example: An 8 kW Array Through a Hot Day
Module: 450W TOPCon, coefficient −0.29%/°C. Ambient 35°C, light wind → cell temperature ≈ 62°C. Delta from STC: 62 − 25 = 37°C. Power penalty: 37 × 0.29% = 10.7%. Real output at full sun: 8 kW × (1 − 0.107) ≈ 7.14 kW. Same array on a 5°C sunny winter morning, cell temp ≈ 25°C: full 8.0 kW — or slightly above it once the sun warms the glass past the cold-soaked morning. Same sun, different physics.
If heat is a design constraint where you build — and in the Southeast and Southwest it is — favor modules with the gentlest coefficient. It's one of the reasons bifacial and N-type modules have taken share so fast: that −0.29%/°C TOPCon coefficient is worth real kilowatt-hours every summer afternoon. Our panel comparison tool lets you sort current inventory by exactly this spec.
During active rain, production drops to the 10–25% range — rainclouds are dense. But rain is also the cheapest maintenance crew you'll ever hire. Dust, pollen, bird droppings, and road film accumulate on glass and cost a typical array 2–5% of annual energy; in arid, agricultural, or high-traffic corridors, unmanaged soiling can run far higher. A decent rain resets the clock.
| Soiling Environment | Typical Annual Energy Loss (No Cleaning) | Mitigation |
|---|---|---|
| Suburban, regular rainfall | 1–3% | None needed — rain handles it |
| Pollen-heavy spring regions | 3–6% | One post-pollen rinse if rain misses the window |
| Dusty / agricultural corridors | 5–15%+ | Scheduled cleaning or monitoring-triggered washes |
| Arid desert, rare rain | 10–25% (extreme cases) | Robotic or contracted cleaning programs at utility scale |
The practical advice: if your monitoring shows a gradual, weeks-long slide followed by a jump after a storm, that's soiling, not degradation. We've diagnosed "failing" systems over the phone that a garden hose would have fixed. Our solar maintenance guide covers safe cleaning; on a roof, never dry-scrub — you grind the grit into the glass.
Moderate wind is a production ally. Airflow strips heat from the module backsheets, dragging cell temperature down and handing back several percent of power on hot days — a breezy 32°C afternoon will measurably out-produce a dead-calm one at the same irradiance. Behind the scenes, that's why racked ground mounts and tilted rooftop arrays beat flush, zero-airflow mounting on hot-climate yield.
Strong wind is a different conversation — a structural one. Modules and racking are rated to specific uplift and downforce loads (typically 2400–5400 Pa depending on product), and your local code maps design wind speed to required ratings. This is permitting territory, not production territory: the mounting guide and permitting guide cover the attachment engineering that keeps arrays on roofs in storm country.
Snow and Ice: Less Scary Than It Looks

Snow stops production while it covers the glass — full stop, zero watts. The surprise is how little that costs annually. Panels are dark, glass-fronted, and tilted: sun warms them, the bottom layer of snow lubricates, and sheets slide off far sooner than the roof around them clears. For most US installs at a 25–35° tilt, total annual snow loss lands in the low single digits:
| Array Tilt | Typical Annual Snow Loss (Snow-Belt Climate) | Field Behavior |
|---|---|---|
| 10–15° (low slope) | 8–15% | Snow lingers; clearing events are slow and partial |
| 25–35° (typical residential) | 2–6% | Self-clears within 1–2 sunny days of most storms |
| 40°+ (steep / winter-optimized) | 1–3% | Sheds fast; also captures low winter sun at a better angle |
And there's a bonus hiding in the white stuff: fresh snow cover is highly reflective, and albedo gain off a snowfield meaningfully boosts bifacial ground mounts and even adds a few percent to monofacial arrays once the glass clears. Don't climb an icy roof with a broom chasing that last 3% — the safety math never pencils. Let the tilt do the work.
Stack all of the above together and you get the seasonal curve. Day length and sun angle dominate: at mid-latitudes (think Louisville, Kansas City, Denver), a fixed-tilt array receives roughly 5.5–6.5 peak sun hours per June day against 2.5–3.5 in December. Heat takes a bite out of summer; cold hands some efficiency back in winter. The net shape, for a typical 8 kW residential array at mid-latitude:
| Season | Avg Peak Sun Hours/Day | Est. Daily Production (8 kW array, ~80% system efficiency) | Driver |
|---|---|---|---|
| June (summer) | ~6.0 | ~38 kWh/day | Long days, high sun — minus a heat penalty |
| April / September (shoulder) | ~4.5 | ~29 kWh/day | Cool temps + decent sun: the efficiency sweet spot |
| December (winter) | ~2.8 | ~18 kWh/day | Short days, low angle — helped by cold-module efficiency |
Read the shoulder-season row twice. Cool, bright April and September days are when modules run closest to nameplate — the efficiency sweet spot where irradiance is still strong but cell temperatures stay low. Customers are always surprised that their single best production day of the year is rarely in July.
Annualize it and weather becomes a planning input rather than a mystery: a properly modeled US array lands within about ±10% of its production estimate in most years, with wet years and drought years marking the tails. That band matters for financing and for sanity — a "bad year" that's 7% under model is usually just weather, while a system that's 25% under model in an average year has a real problem worth hunting. Model your own numbers with the solar system calculator and check long-term economics on the ROI calculator.
Three smaller factors round out the weather picture. Humidity and atmospheric haze scatter short-wavelength light before it reaches the array, which is part of why humid Gulf Coast sites underperform their sunshine-hours reputation against high-desert sites at equal latitude — same sun angle, meaningfully different delivered energy. Altitude runs the other direction: thinner air means less atmospheric filtering, and arrays at elevation can see irradiance several percent above sea-level equivalents on clear days — one reason mountain and high-plains sites punch above their weight. And morning dew deserves a mention mostly to calm people down: panels waking up wet produce slightly less for an hour, then the sun burns it off and the day proceeds. It's a rounding error, not a maintenance task.
None of these change design decisions the way temperature coefficient or snow tilt do. They change expectations — the difference between an owner who understands a humid summer's slightly soft numbers and one who thinks the system is failing. Expectation-setting is cheap; do it at handover, not after the first service ticket.
Weather explains almost every "problem" homeowners report — once you know how to read the pattern. A production curve that mirrors the day's cloud cover, with jagged minute-to-minute swings, is normal broken-cloud behavior. A smooth curve that's uniformly lower than last month is seasonal angle or heat. A gradual multi-week slide that snaps back after a storm is soiling. A flat zero is an actual fault — inverter offline, a tripped disconnect, or a string failure — and that one deserves a service call, not a weather shrug.
The discipline that separates a good install from a great one is baseline comparison. Compare today's curve against the same conditions from your own array's history, not against the nameplate. A system making 22 kWh on a 3-PSH December day in Ohio is performing perfectly; the same 22 kWh on a clear June day is a red flag. Modern monitoring — especially module-level systems — makes this comparison a ten-second job, and it's the difference between a confident homeowner and a confused one with a complaint ticket.
One more pattern we see every spring: customers convinced their array is degrading because March output is down versus last year — when the real driver is two extra weeks of rain in the regional weather record. Pull the irradiance data before you pull a panel. The sun's logbook almost always explains the system's.
Hail is a durability question more than a production question. Certified modules survive IEC/UL hail testing — 25mm (1-inch) ice balls fired at roughly 23 m/s (about 51 mph) — and quality Tier 1 glass routinely survives larger stones. What hail costs you operationally is the post-storm inspection: microcracks don't always kill output immediately, but they seed the hot spots and moisture paths that show up three years later. After any severe hail event, a visual plus electroluminescence or thermal inspection is money well spent, and your insurance carrier will want the documentation either way.
Wildfire smoke and haze have become a measurable production factor across the West and, in bad fire seasons, well beyond it. Dense smoke plumes act like a continent-wide cloud deck — monitoring networks have logged regional irradiance drops of 10–30% during heavy smoke events, with the worst days far deeper. The good news: smoke losses are temporary, and the first real rain clears both the sky and the glass.
Hurricanes and high-wind events live at the intersection of engineering and insurance. Arrays built to current wind maps with proper attachment spacing have an impressive survival record — post-storm surveys after recent Gulf and Atlantic hurricanes found code-compliant rooftop arrays largely intact on roofs that lost shingles all around them. The failure pattern in storm surveys is almost always attachment and edge-zone pressure, not the modules themselves.
| Extreme Condition | Typical Production Impact | Design / Response |
|---|---|---|
| Hail (sub-severe) | None immediate; latent microcrack risk | Post-storm inspection; document for insurance |
| Heavy wildfire smoke | 10–30% regional drop during events | None — temporary; verify recovery after rain |
| Hurricane-force wind | Binary: survives or doesn't | Code-compliant attachment, edge-zone fastening, engineered racking |
| Extreme heat waves | 10–16% hourly power penalty at peak | Low-coefficient modules; airflow under array |
- Choose gentle temperature coefficients. In hot climates, N-type TOPCon and HJT modules return their premium every summer.
- Bifacial where albedo cooperates. Ground mounts over light gravel or snow country see real rear-side gain.
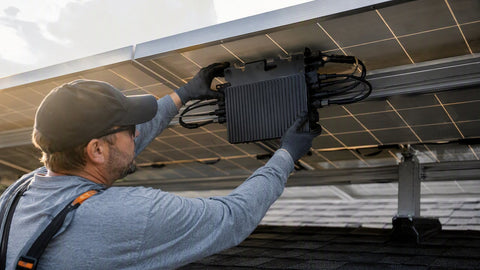
- Module-level power electronics. Microinverters and optimizers keep one shaded or snow-dusted module from dragging a string — our inverter buyer's guide maps the trade-offs.
- Tilt for your winter. In snow country, a steeper tilt is a production feature, not just a roof constraint.
- Monitor, then maintain. A system that reports per-module or per-string turns "is weather hurting me?" from a guess into a ten-second check.
We stock the hardware side of that list — from Mission Solar 380W PERC modules to URE 445W mono panels and the inverters behind them. Get a project quote and we'll spec for your climate, not a brochure.
Do solar panels work on cloudy days?
Yes. Panels convert diffuse light as well as direct beam, producing roughly 75–90% of rated output under thin high cloud and 10–25% under full overcast. Heavy storm clouds can push output to 5–10%. Annual energy is what matters financially, and cloudy-day contributions are already baked into any decent production model for your location.
Do solar panels work better in hot or cold weather?
Cold — decisively. Module power is rated at a 25°C cell temperature, and output falls by the temperature coefficient (about −0.25 to −0.40% per °C depending on cell technology) for every degree above that. A cold, sunny day routinely out-produces a hot one at equal irradiance. Winter's short days cost far more energy than summer's heat, but hour for hour, cold wins.
How much does rain reduce solar production?
During active rainfall, expect 10–25% of rated output because rainclouds are dense. Over the year, though, rain usually nets positive in most US climates by washing off dust and pollen that would otherwise cost 2–5% of annual energy. A gradual production slide that jumps after a storm is soiling, not equipment failure.
How much energy do solar panels lose to snow?
Less than most owners fear. At typical residential tilts of 25–35°, arrays self-clear within a day or two of most storms, and annual snow loss in snow-belt climates usually totals 2–6%. Low-slope arrays at 10–15° can lose 8–15%. Steep winter-optimized tilts of 40° or more shed fastest and capture low-angle winter sun better.
What is a solar panel temperature coefficient?
It's the percentage of rated power a module loses (or gains) per degree Celsius of cell temperature above (or below) the 25°C test condition. Typical values: mono PERC around −0.34 to −0.40%/°C, N-type TOPCon about −0.29 to −0.30%/°C, HJT around −0.24 to −0.26%/°C, and CdTe thin-film roughly −0.20 to −0.28%/°C. Lower magnitude is better in hot climates.
How much more does a solar system produce in summer than winter?
At US mid-latitudes, fixed-tilt arrays typically produce 1.5–2 times more energy in a peak summer month than a deep winter month, driven mostly by day length and sun angle rather than temperature. An 8 kW array making roughly 38 kWh on a June day might make around 18 kWh on a December day in the same location.
Spec'd for Your Climate, Not a Brochure
High-temp coefficient modules, bifacial options, and module-level electronics — PES Supply stocks 50,000+ SKUs from 169 authorized brands with nationwide freight from Louisville, KY.
Shop Solar Panels Get a Project QuoteRelated Guides & Resources
- Solar System Calculator — size the array
- Solar ROI Calculator — payback and 25-year savings
- Solar Panel Comparison Tool — sort by temperature coefficient
- Solar Maintenance Guide — cleaning and inspection
- Solar Panel Mounting Guide — tilt, wind load, attachment
- Solar Inverter Buyer's Guide — string vs. micro vs. optimizer
- Solar Installation Guide
- Bifacial Solar Panels
- Solar Inverters
About PES Supply
PES Supply is a nationwide distributor of Tier 1 solar panels, inverters, battery storage, racking, and complete electrical project kits — 50,000+ SKUs across 169 authorized brands with full OEM warranties and nationwide LTL freight from our Louisville, Kentucky supply house. Phone: 1-888-876-0007 • portlandiaelectric.supply