Industrial solar is a different animal from residential. The panels look similar on a pallet, but the buying logic, the electrical design, and the failure consequences are not the same. A bad module choice on a house costs a homeowner a few hundred dollars a year. A bad module choice on a 2 MW cold-storage roof costs an EPC its warranty reserve and a facility manager its demand-charge budget. This guide is written for the people who sign purchase orders: EPCs, developers, facility managers, and procurement leads who need industrial solar panels that pencil out over 25 to 30 years of service.

We stock and ship industrial solar panels to job sites across the country, and the patterns below come from real quotes, real submittals, and real warranty calls. If you are pricing a project right now, you can browse current inventory in our commercial solar panels and utility-scale panels collections, or read the companion piece on commercial solar installation costs for the installed-price side of the math.
What "Industrial" Actually Means in a Module Spec
The industry uses "industrial" loosely. For buying purposes, a panel earns the label when it meets four tests at once:
- Format and wattage: Large-format modules, typically 144 half-cells or more, 540 W and above. The residential 400 W class costs more per watt to install because labor, racking attachments, and wire runs scale with module count, not watts.
- Voltage rating: 1,500 V system rating for utility and large C&I strings. A 1,000 V ceiling forces shorter strings and more combiner inputs, which is copper and labor you did not need to spend.
- Mechanical load ratings: Published front and rear load test values (5,400 Pa front / 2,400 Pa rear is a common minimum; snow-country jobs should look for 7,000 Pa-class front ratings).
- Commercial warranty terms: A product warranty of 12 to 25 years and a linear performance warranty with a stated first-year degradation and annual degradation rate, backed by a bankable manufacturer.
Anything missing one of those four is a residential panel wearing a hard hat. I have seen 400 W residential-format modules value-engineered into a 600 kW carport job to save two cents a watt on paper; the installer ate the difference in racking attachments and labor before the second array row was up.
Technology Types: Mono, Poly, and Thin-Film
The technology table below is the one we hand to purchasing teams when they ask why poly has largely disappeared from bid tabs.
| Technology Type | Typical Efficiency | Cost Profile | Best For (Use Case) | Critical Weakness |
|---|---|---|---|---|
| Monocrystalline | 18% - 23% | High | Rooftop C&I projects; space-constrained sites | Higher upfront cost per panel |
| Polycrystalline | 16% - 19% | Medium | Large ground-mount utility farms; budget-driven jobs | Lower efficiency requires more physical space |
| Thin-Film | 10% - 16% | Low-Medium | High-temperature climates; architectural integration | Lowest efficiency; requires largest footprint |
Two updates matter for current buying. First, polycrystalline supply has dried up to the point that most "poly" quotes are stale datasheet pulls; new capacity is mono PERC, TOPCon, or HJT. Second, TOPCon has taken over the mid-market: n-type TOPCon modules commonly ship at 22.5% to 23.2% efficiency with first-year degradation around 1% and linear degradation near 0.40% per year after that, versus roughly 2% and 0.55% for older p-type PERC. On a 30-year cash-flow model, that degradation gap is worth real money — a 1 MW array losing 0.40% per year instead of 0.55% keeps roughly 30 MWh more production in year 20 alone.
Thin-film still earns its place in two niches: high-ambient-temperature sites where its superior temperature coefficient closes the efficiency gap, and architectural or weight-limited roofs where glass-glass crystalline simply will not fit the structural budget.
The Spec Sheet Numbers That Actually Move Your LCOE
Datasheets run two pages. Four numbers on page one decide most of the economics:
1. Module efficiency
Efficiency is area economics. On a constrained rooftop, the difference between a 20.5% module and a 22.8% module is the difference between fitting 780 kW and fitting 865 kW on the same roof. More watts per square foot also means fewer modules, fewer clamps, and fewer home runs for the same DC capacity.
2. Temperature coefficient of Pmax
Every module loses power as the cell heats up. Typical coefficients run -0.34%/°C to -0.24%/°C. On a dark membrane roof in Texas, cell temperatures routinely hit 65°C to 70°C — that is 40°C to 45°C above STC. A -0.34%/°C module gives up about 14% of nameplate at those temperatures; a -0.24%/°C n-type module gives up about 10%. On a 1 MW array, that four-point gap is roughly 40 kW of real capacity on the hottest afternoons, which is exactly when demand charges are being set.
3. Degradation schedule
Read the warranty's first-year number and annual number separately. "87.4% at year 30" sounds identical across brands until you realize one gets there with 1% first-year plus 0.40% annual and another with 2.5% first-year plus 0.55% annual. Model both in PVSyst or your LCOE spreadsheet before you sign.
4. Bifaciality and rear-side gain
For ground-mount and high-albedo roofs (white TPO, light gravel), bifacial solar panels with a bifaciality factor of 70% to 80% add 5% to 15% real energy yield depending on albedo, height above grade, and row spacing. On white membrane commercial roofs we typically model 6% to 9%. For dark shingle residential roofs, bifacial gain is a rounding error — do not pay for it there.
Sizing the Array to the Load

Industrial buyers usually start from the utility bill, not the roof. The table below uses a conservative 1,350 kWh/kWp annual yield (a reasonable blended figure for much of the Midwest and Southeast; the Southwest runs 1,600+ and the Pacific Northwest closer to 1,100):
| Annual Facility Usage | Avg. Daytime Load (10-hr day) | Solar Size for 60% Offset | Solar Size for 90% Offset | Approx. Roof Area Needed (22% eff.) |
|---|---|---|---|---|
| 500,000 kWh | ~137 kW | ~222 kW | ~333 kW | ~1,350 m² (90% offset) |
| 1,000,000 kWh | ~274 kW | ~444 kW | ~667 kW | ~2,700 m² (90% offset) |
| 2,500,000 kWh | ~685 kW | ~1,111 kW | ~1,667 kW | ~6,750 m² (90% offset) |
| 5,000,000 kWh | ~1,370 kW | ~2,222 kW | ~3,333 kW | ~13,500 m² (90% offset) |
Check the arithmetic the way we do: 1,000,000 kWh × 0.90 = 900,000 kWh ÷ 1,350 kWh/kWp = 667 kWp. At 22% module efficiency, 1 kWp needs about 4.05 m² of module area (1,000 W ÷ 220 W/m² ≈ 4.05 m²), so 667 kWp ≈ 2,700 m² of module face, before walkways, setbacks, and fire lanes. Real roofs need 25% to 40% more gross area than module face area once you honor fire-code pathways and mechanical equipment shadows.
Load shape matters as much as load size. A cold-storage facility with flat 24/7 refrigeration load uses nearly every kWh on site. An office that empties at 6 PM exports weekend production at whatever the utility's avoided-cost rate happens to be — often a third of retail. If your avoided-cost export rate is poor, size toward the daytime minimum load and consider shifting the rest into an energy storage system rather than oversizing the array.
Electrical Design: NEC Math You Cannot Skip
Industrial arrays live in NEC Article 690 territory, and two calculations gate everything downstream: maximum system voltage (690.7) and circuit ampacity (690.8 plus 310.16).
String voltage under NEC 690.7
Maximum system voltage is module open-circuit voltage corrected for the coldest expected ambient temperature, using the correction factors in NEC Table 690.7(A):
| Lowest Expected Ambient | NEC 690.7(A) Correction Factor |
|---|---|
| 4°C to 0°C | 1.10 |
| -1°C to -5°C | 1.12 |
| -6°C to -10°C | 1.14 |
| -11°C to -15°C | 1.16 |
| -16°C to -20°C | 1.18 |
| -21°C to -25°C | 1.20 |
| -36°C to -40°C | 1.25 |
Worked example we run weekly: a modern 585 W module with Voc of 52.9 V on a job in Minneapolis (design low -20°C, factor 1.18) shows a corrected Voc of 52.9 × 1.18 = 62.4 V per module. On a 1,500 V system, the string limit is 1,500 ÷ 62.4 = 24.03, so 24 modules per string. The same string in Phoenix (factor 1.10) allows 1,500 ÷ 58.2 = 25.7, so 25 modules. One module of difference per string, across hundreds of strings, is a meaningful labor and copper delta — and getting it wrong in the cold direction is a smoked inverter MPPT input in January.
Circuit ampacity under NEC 690.8 and 310.16
NEC 690.8 defines maximum circuit current as Isc × 1.25, and conductor/OCPD sizing applies a further 1.25 continuous-duty multiplier — the familiar 1.56 × Isc rule. With module Isc of 14.4 A: maximum circuit current = 14.4 × 1.25 = 18.0 A; conductor and OCPD basis = 14.4 × 1.56 = 22.5 A. NEC 240.6(B) standard OCPD ratings step 20 → 25 → 30 A, so the source-circuit fuse or breaker lands at 25 A, and the conductor must carry 22.5 A after all derating. From NEC 310.16's 90°C copper column, 10 AWG THHN/PV Wire is rated 40 A — comfortably sufficient after typical rooftop temperature and conduit-fill corrections, which is why 10 AWG PV Wire remains the default source-circuit conductor on industrial jobs. Our NEC wire sizing guide and the wire ampacity chart carry the full 310.16 tables, and the PV Wire vs. USE-2 vs. THHN guide covers insulation selection.
For the interconnection side, the NEC 690 disconnect and overcurrent protection guide walks through the 120% busbar rule (705.12) that decides whether a 400 A panel can accept a given backfeed breaker. On industrial services, supply-side taps are usually cleaner than load-side connections once inverter output current exceeds roughly half the service rating.
Mounting Systems: Fixed-Tilt vs. Trackers
The mounting decision is structural, financial, and logistical at once. This table stays taped to our estimators' wall:
| Mounting System | Best For | Key Consideration |
|---|---|---|
| Fixed-Tilt | Rooftop projects, high-wind areas, and budget-conscious builds. | Simpler logistics and lower maintenance, but generates less energy per panel. |
| Trackers | Large ground-mounts, maximizing energy output (yield can increase 15-25%). | More complex logistics, higher upfront costs, and requires ongoing O&M. |
Racking is typically 10% to 15% of total project cost, and it drives the module choice more often than buyers expect: tracker rows favor long, large-format bifacial modules, while ballasted roofs favor lighter modules with published load ratings under the specific racking brand's test reports. Mixing a module and a rack without a shared test letter is how projects die in permitting. Browse current racking inventory in racking and mounting, and see the deeper dive on solar panel racking systems.
What Industrial Solar Panels Cost Right Now
Module-only pricing moves with the polysilicon market and tariff policy, but current U.S. wholesale ranges for industrial-format modules look like this:
| Module Class | Typical Wattage | Efficiency Range | Wholesale $/W (pallet+) | Best Fit |
|---|---|---|---|---|
| Mono PERC (p-type) | 540–565 W | 20.9–21.7% | $0.22–$0.30/W | Budget ground-mount, carports |
| TOPCon (n-type) | 570–620 W | 22.0–23.2% | $0.26–$0.36/W | Space-constrained C&I roofs, trackers |
| Bifacial TOPCon dual-glass | 580–640 W | 22.5–23.3% (front) | $0.30–$0.40/W | High-albedo ground-mount, white TPO roofs |
| HJT | 700–740 W | 22.8–23.8% | $0.34–$0.45/W | Maximum density, hot climates (-0.24%/°C class) |
Do the landed-math honestly: at $0.30/W, the modules for a 1 MW job are $300,000. A two-cent swing is $20,000 — real money, but less than one week of schedule slip costs on most industrial sites. Availability and documentation (UL 61730 listing, factory test reports, warranty registration support) are worth more than the last cent per watt. Our 550–709 W panel collection shows live wholesale pricing, and the best solar panels 2026 roundup compares the brands we actually see perform.
Procurement: How Smart Buyers Structure the Purchase

On jobs above about 500 kW, structure the buy in writing:
- Lock the bill of materials early. Module model number, exact revision, connector type, and cable length. "Or equivalent" language in a module spec is how you end up re-engineering string lengths in week six.
- Buy spares with the main order. 0.5% to 1% attic stock, same production batch. A forklift fork through one pallet two years from now should not force a mixed-batch repair.
- Stage delivery against the racking schedule. Modules arriving before piles are torqued sit in a laydown yard collecting risk. Sequence pallets to arrive within two weeks of array-field readiness.
- Verify flash reports. Reputable manufacturers provide per-module flash data. On utility jobs, require it; on C&I, ask for it and read the spread. A batch with a ±6 W spread behaves differently under a string inverter than a tight ±2 W batch.
- Register warranties at commissioning. The warranty clock and the registration database are what your facility manager will be calling about in year nine.
I once watched a developer save $11,000 by taking a gray-market pallet deal on a 700 kW school job, then spend $30,000 and six weeks getting UL documentation the AHJ would accept. Buy traceable modules the first time. Brands we can stand behind on documentation are in the catalog under names like Jinko Solar, with live inventory across the broader solar panels category.
Inverter Pairing and the Rest of the BOS
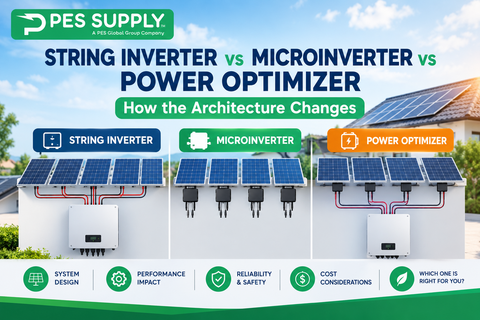
Module selection drives inverter selection. Three-phase string inverters dominate C&I from 100 kW to about 2 MW; central inverters take over above that. Keep the DC/AC ratio between 1.2 and 1.35 for most fixed-tilt C&I work — high enough to fill the inverter's morning and evening shoulders, low enough that clipping losses stay under 1% annually. Tracker jobs with bifacial modules can justify 1.35 to 1.45 because the production curve is flatter. Our commercial solar inverters and string inverter collections carry the three-phase units we pair with these arrays.
Warranty Red Flags in Industrial Bids
Three clauses to read before you sign anything:
- Labor coverage. A "25-year warranty" that pays for a replacement module but not the truck roll and lift to swap it is worth about 60% of face value on a roof 40 feet up.
- Transferability. Industrial properties change hands. A warranty that dies on sale is a valuation haircut at exit.
- Claim thresholds. Some performance warranties only trigger after measured degradation exceeds the schedule by a set margin, measured by the manufacturer's chosen method. Know the test protocol before you need it.
Field Notes: What Actually Breaks
After years of warranty calls, the pattern is consistent: modules themselves rarely fail. What fails is the interface — connectors from two different tool-less brands mated in the field, wire management that lets PV Wire touch sharp racking edges, and junction boxes baked by cheap bypass diodes. I tell every procurement lead the same thing: spec the module for the warranty and the datasheet, then spend your worry budget on connectors, wire management, and installation QA. That is where industrial arrays actually live or die.
Demand Charges: The Number Residential Guides Never Mention

Residential solar math is about energy: kilowatt-hours offset times the retail rate. Industrial math has a second column — demand charges, billed on your single highest 15-minute peak each month. For many C&I rate structures, demand is 30% to 50% of the bill. Solar alone shaves demand charges only when your peak reliably lands in sunlit hours. A 3 PM summer peak on a west-facing array? Yes, solar bites it. A 7 AM winter production start-up peak? Solar misses it entirely, and your demand charge sails through untouched.
Measure before you promise: pull 12 months of interval data from the utility (green button or a formal data request), overlay a modeled solar production profile, and count how many monthly peaks the array would actually have clipped. On the last three industrial quotes I built, solar-alone demand reduction came in at 18%, 34%, and 41% of the peaks — a huge spread driven entirely by load shape, not by anything on a module datasheet. If the answer disappoints, the fix is a battery storage layer dispatched against the peak, not a bigger array.
A Worked Payback Example With Real Arithmetic
Take a 500 kW rooftop array on a distribution warehouse in Ohio, $0.28/W modules, $1.35/W all-in installed cost:
| Line Item | Value | Basis |
|---|---|---|
| Installed cost | $675,000 | 500 kW × $1.35/W |
| Annual production (year 1) | 655,000 kWh | 500 kW × 1,310 kWh/kWp (Ohio blended yield) |
| Blended value per kWh | $0.098 | $0.083 energy + demand and riders, net of export rules |
| Year-1 savings | $64,190 | 655,000 × $0.098 |
| 30% ITC (48E, with domestic content bonus where applicable) | -$202,500 to -$270,000 | 30% base; +10% domestic content bonus if certified |
| MACRS 5-year depreciation value (21% corp. rate) | ~$120,500 | Depreciable basis = 85% of cost (half-ITC rule); 85% × $675,000 × 21% ≈ $120,469 |
| Simple payback | ~6.0–7.3 years | Net cost ÷ year-1 savings |
Notice what the table does not do: it does not assume a residential-style retail-rate offset, and it does not bury the demand-charge question. If your interval data shows solar clipping only a quarter of peaks, drop the blended value accordingly before you show the CFO a payback number. Overpromising payback is how EPCs lose reference customers.
Interconnection: The Schedule Risk Nobody Prices
Module lead times are measured in weeks. Utility interconnection studies are measured in quarters, and distribution-system upgrades are measured in years. For industrial projects above roughly 1 MW, start the interconnection application before you finalize the module selection — the utility process is the critical path, not the equipment. A realistic sequence: pre-application report (4 to 8 weeks), system impact study (3 to 9 months depending on queue depth), facilities study if upgrades surface, then the interconnection agreement. Module procurement can flex inside that window; the window will not flex around your modules.
One hard-won habit: order long-lead electrical gear (switchgear, transformers, medium-voltage breakers) at notice-to-proceed, not after the interconnection agreement is signed. Switchgear lead times have run 30 to 50 weeks in recent years. The array can be racked, wired, and flashed while the gear sits on a ship, and a finished array waiting on a main breaker earns nothing.
Operations and Maintenance: Budget for the Boring Stuff
Industrial arrays fail quietly. A single failed optimizer or a blown string fuse costs 2% of production and nobody notices until the quarterly report. Budget O&M at $8 to $15 per kW per year for rooftop C&I and $10 to $18 per kW for ground-mount with vegetation management, and specify monitoring that alarms on string-level deviation, not just total-plant underperformance. The monitoring layer — gateways, cellular modems, and sensor packages — is cheap insurance; we stock it under monitoring and communications.
My rule from the service side: if the monitoring cannot tell you which string is down within one day of the fault, you do not have monitoring — you have a monthly surprise. String-level data has paid for itself on every portfolio I have seen it deployed on.
Degradation Modeling: 25 Years on One Row of a Spreadsheet
Build the degradation schedule explicitly. For a TOPCon module at 1.0% first-year and 0.40% annual thereafter, on a 655,000 kWh year-1 base:
| Year | Retention Factor | Production (kWh) |
|---|---|---|
| 1 | 1.000 | 655,000 |
| 5 | 0.974 | 637,970 |
| 10 | 0.954 | 624,870 |
| 20 | 0.914 | 598,670 |
| 25 | 0.894 | 585,570 |
| 30 | 0.874 | 572,470 |
Check the math: year 30 retention = 1 − 0.010 − (29 × 0.004) = 0.874. A p-type PERC module at 2%/0.55% lands at 0.820 — about 7% less energy in year 30, every year, forever. That is the whole TOPCon premium argument compressed into one column.
Frequently Asked Questions
What wattage should industrial solar panels be in 2026?
For commercial rooftops, 570 W to 620 W large-format modules hit the best balance of handling and density. For ground-mount and tracker projects, 580 W to 740 W bifacial formats dominate current bid tabs.
Is TOPCon worth the premium over PERC for industrial projects?
Usually yes. The 1.5 to 2.5 percentage-point efficiency gain, roughly 0.10%/°C better temperature coefficient, and 0.15% per year lower degradation typically repay a $0.03–$0.06/W premium within the first decade of operation.
How many industrial solar panels does a 1 MW system need?
With 585 W modules: 1,000,000 W ÷ 585 W ≈ 1,710 modules. With 430 W-class modules the count rises to about 2,326, which is why module wattage is a labor decision, not just a spec-sheet number.
What certifications must industrial solar panels carry?
UL 61730-1/-2 listing is the baseline AHJ requirement in the U.S. IEC 61215/61730 covers international performance and safety qualification. For incentive programs, check the relevant domestic-content or approved-vendor lists for your state.
How long do industrial solar panels last?
Modern crystalline modules carry 25- to 30-year linear performance warranties and commonly produce for 35 years or more. Budget for inverter replacement at years 12 to 15 and module-level O&M throughout.
Should I buy bifacial panels for a commercial flat roof?
On white TPO or PVC membrane with racking elevated 18 inches or more, bifacial typically adds 5% to 9% yield and earns its premium. On dark roofs or low-profile ballasted systems, rear-side gain is under 2% — stick with monofacial and pocket the savings.