Every solar panel on every roof is slowly dying. That's not a reason to avoid solar — it's the physics that separates a good 25-year investment from a disappointing one. We test, ship, and warranty thousands of panels a year, and we've watched degradation curves play out across entire fleets: the difference between a panel making 92% of its original output at year 20 and one making 80% is thousands of dollars per residential system and six figures on commercial portfolios. We've also seen the panic version of this conversation — a homeowner watching a cloudy-month production dip, convinced their five-year-old panels are failing, when the meter is really reporting weather. Both conversations start the same way: with the numbers, in order, without drama. This guide covers what degradation actually is, the rates by technology, what accelerates it, and what you can do about it — before and after installation.
What Degradation Actually Is
Solar panel degradation is the gradual decline in power output over time, expressed as a percentage lost per year. It comes from physical mechanisms at the cell and module level: light-induced degradation (LID) when panels first see sun, potential-induced degradation (PID) from voltage stress, UV damage to encapsulants, thermal cycling fatigue on solder bonds and interconnects, moisture ingress, and microcrack propagation from handling and weather. Some of these are one-time events; others compound annually.
The number that matters is the annualized rate. The industry median for modern panels sits around 0.4–0.55% per year after the first year. NREL's long-running field studies — the largest dataset on this question — have measured median degradation around 0.5–0.8%/yr across thousands of older systems, with newer premium modules demonstrably better. First-year degradation is higher (1–2.5%) because of LID, which is why warranty tables always separate year one from the years after.
Degradation by Cell Technology: The Numbers That Matter
Cell architecture drives the degradation curve more than any other variable. Here's what the field data and manufacturer warranties show for the technologies actually shipping in 2026:
| Cell Technology | Year 1 Degradation | Annual Degradation (Years 2+) | Output at Year 25 | Susceptible to LID? |
|---|---|---|---|---|
| P-type Mono PERC | 1.8–2.5% (field) | 0.55–0.70%/yr | 80–84% | Yes (1–3% typical) |
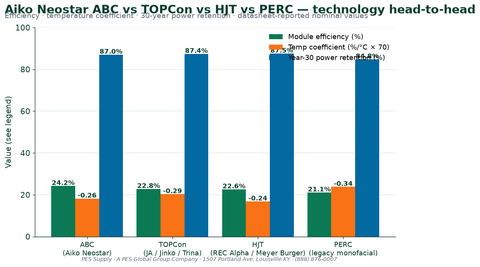
| N-type TOPCon | 1.0–1.5% | 0.38–0.45%/yr | 85–89% | Minimal |
| N-type HJT | 1.0–1.5% | 0.35–0.40%/yr | 86–90% | Minimal |
| N-type Back Contact (IBC/HPBC) | ~1.0% | 0.35–0.45%/yr | 86–89% | Minimal |
| Thin-film (CdTe) | ~1% | 0.30–0.50%/yr | 85–90% | No (different mechanisms) |
The headline: N-type panels lose roughly half a percentage point less per year than legacy P-type PERC, and they barely suffer LID at all because their phosphorus-doped base doesn't form the boron-oxygen complexes that sap P-type cells on first light exposure. Compounded over 25 years, that gap is worth 4–6% more lifetime energy from the same roof. It's a major reason the market flipped to TOPCon as the default technology — we now stock N-type across nearly our entire panel catalog, including the TOPCon N-type collection, because the degradation math makes the small price premium trivially easy to justify.
Warranties: Reading the Fine Print That Protects You
Solar warranties come in two distinct documents that people constantly conflate:
| Warranty Type | Standard Duration | What It Covers | Typical Year-25 Floor |
|---|---|---|---|
| Product warranty | 10–12 years (up to 25 on premium) | Defects in materials and workmanship — delamination, junction box failure, frame failure, broken glass from defect | N/A |
| Performance warranty | 25–30 years | Power output staying above a guaranteed degradation curve | 80–87% of nameplate, technology-dependent |
Read the performance warranty as a curve, not a number. A quality N-type warranty reads: ≥98–99% at year 1, then no more than 0.4%/yr decline, ≥87.4% at year 25 (or year 30). Compare that against a commodity PERC warranty of 97.5% year 1, 0.55%/yr, 84.8% at year 25. Then — this is the part nobody does — check who stands behind it. Manufacturer insolvency voids warranties in practice, and the industry's consolidation means manufacturer bankability is part of your degradation protection. Third-party insured warranties exist for exactly this risk on financed projects.
A 25-Year Worked Example: PERC vs. TOPCon on a 400W Panel
Numbers make this concrete. Two 400W panels, one legacy PERC (2% year 1, then 0.55%/yr) and one TOPCon (1% year 1, then 0.38%/yr):
| Year | PERC (0.55%/yr after year 1) | TOPCon (0.38%/yr after year 1) | Difference (W) |
|---|---|---|---|
| 1 (after LID) | 392W (−2%) | 396W (−1%) | 4W |
| 5 | 381W | 389W | 8W |
| 10 | 371W | 382W | 11W |
| 15 | 360W | 374W | 14W |
| 20 | 349W | 367W | 18W |
| 25 | 339W | 359W | 20W |
Scale that to a 20-panel residential array: the TOPCon system delivers about 400W more output at year 25 — and more every single year before that, because the curves diverge from day one. Summed over 25 years at 1,400 kWh/kW annual yield and $0.15/kWh, the lifetime production gap runs roughly $1,500–2,500 per residential system. On a 1 MW commercial array, multiply by fifty. Panel degradation isn't an abstraction; it's a line item in your financial model whether you put it there or not. And the gap keeps widening past year 25 — the warranty's endpoint is a paperwork milestone, not a physical one, so the technology that degrades slower keeps paying dividends through years 26 to 35 while the faster one approaches its useful floor.
What Accelerates Degradation in the Field
Lab ratings assume controlled conditions. Real roofs add stressors, and we've diagnosed underperformance from every one of these:
- Heat. Cell temperature is the master variable. Panels on dark roofs with minimal airflow gap run 15–25°C hotter than well-ventilated mounts, and sustained heat accelerates encapsulant browning and solder fatigue. Hot-climate arrays degrade measurably faster than identical equipment in mild climates — plan on the high end of the rate range in the desert Southwest.
- Thermal cycling. Daily expansion and contraction fatigues cell interconnects. High-diurnal-swing climates (cold nights, hot days) age panels faster than constant-temperature coastal climates.
- Mechanical load and microcracks. Snow load, wind, and — most commonly — careless handling during installation create cell microcracks that grow over years into dead cell zones. We reject freight-damaged pallets on sight for this reason; a panel can look perfect and carry cracks that cost 5% output by year five.
- PID (potential-induced degradation). High system voltage to ground, humidity, and heat combine to leak current through the module and polarize cells. Modern N-type modules with POE encapsulants are largely PID-resistant; older systems in humid climates lost 10–30% to PID before the industry understood it.
- Soiling and shading. Not degradation strictly speaking, but chronic soiling and new shading (trees grow) masquerade as it in production data — and hot spots from partial shade genuinely damage cells over time.
- Coastal salt and ammonia. Salt mist and agricultural ammonia corrode frames, junction boxes, and cell metallization. Coastal and farm installs need modules with the corresponding IEC certifications (61701 salt mist, 62716 ammonia).
Installation Practices That Protect the Degradation Curve
Half of degradation protection happens on install day. Our crews' checklist:
- Handling. Panels carried flat, never by the junction box cable, never walked on, never leaned at harsh angles against a truck. Microcracks are installed more often than they're manufactured.
- Clamping zones. Mid-clamps land in the manufacturer's specified clamping zones — outside them, frame flex under snow load cracks cells. The install manual's clamp diagram is not a suggestion.
- Airflow gap. A 3–6 inch gap between module and roof drops operating temperature meaningfully. Rail-less systems that hug tight to the roof trade cell temperature for aesthetics; know the trade.
- Torque discipline. Over-torqued clamps stress frames; under-torqued clamps let modules chatter in wind. We torque-mark every structural bolt with paint pens so inspection is visual, not faith-based.
- Wire management. Cables clipped off the roof membrane, out of standing water, with UV-rated clips. Chafed insulation becomes ground faults, and ground-fault hunting is the least profitable hour in the service business.
Operations: Getting the Most From the Panels You Own
Post-install, the controllables are fewer but real. The best-run residential fleets we've seen share one trait: the owner treats the array like a vehicle with a service schedule, not a roof appliance that runs itself. Five minutes a month glancing at the monitoring app, one Saturday a year with a hose, and a professional inspection every few years captures essentially all the available performance preservation. Everything in the table below is cheap; everything skipped on this table compounds:
| Practice | Frequency | Impact | Cost |
|---|---|---|---|
| Production monitoring with alerts | Continuous | Catches faults in days instead of billing cycles; baseline drift reveals real degradation vs. shading/soiling | $0–15/month |
| Cleaning | 1–2×/year, climate-dependent | Recovers 2–7% in dusty regions; near zero in rainy climates | DIY free; pro $150–300 residential |
| Vegetation trimming | Annual assessment | Eliminates creeping shade losses and hot-spot risk | Varies |
| Visual + thermal inspection | Every 3–5 years | Catches hot spots, delamination, and junction-box heating early — while warranty claims are easy | $200–500 or bundled in O&M |
| Snow removal | As needed, with a roof rake only | Restores production; never scrape or chip ice off glass | Free, done carefully |
The monitoring row pays for everything else on this list. A per-panel or per-string view separates "the system is aging normally" from "one optimizer died in May and nobody noticed until December." Our maintenance guide for extending system life covers the storage side of the same discipline.
When Is Underperformance Actually a Warranty Claim?
The test: compare measured output against the warranty curve, corrected for conditions. A legitimate performance claim needs irradiance-corrected measurement (a production shortfall during a cloudy month is weather, not degradation), soiling eliminated as a variable (clean first), and shading ruled out. In practice, flash-testing or IV-curve tracing a sample of modules gives defensible numbers. File claims with serial numbers, installation date, and measurement data attached. Manufacturers process well-documented claims; they slow-walk vibes. And file early — degradation claims made at year 4 with a clear paper trail are straightforward, while the same claim at year 12 requires arguing about a decade of unmonitored history.
The Mechanisms, Deeper: LID, LeTID, and PID Explained
The Three Primary Degradation Modes
Three acronyms do most of the damage, and understanding them changes what you buy. LID (light-induced degradation) hits P-type PERC cells in the first hours of sun exposure: boron and oxygen in the silicon lattice bond into complexes that trap electrons, costing 1–3% of output almost immediately. Manufacturers pre-treat cells to burn it in at the factory, which is why modern PERC year-one numbers look better than 2015's. LeTID (light and elevated temperature induced degradation) is LID's uglier sibling — it develops over months at operating temperature and can strip 3–6% from vulnerable PERC modules before stabilizing; it nearly derailed PERC's reputation around 2017–2019 until process controls tamed it. N-type cells, doped with phosphorus instead of boron, are structurally immune to both mechanisms, which is the deepest reason the industry migrated.
PID (potential-induced degradation) is a system-level disease: with hundreds of volts between cell circuit and grounded frame, leakage current drifts sodium ions from the glass into the cell and shunts the junction. The signature is a string whose end modules — the ones at highest voltage to ground — fade first and worst. Inverter architecture (transformerless strings with the array floating), module encapsulant chemistry, and climate all conspire. Modern POE-encapsulated N-type modules test at <2% PID loss under 96-hour IEC stress; early-2010s fleets in humid climates lost 20%+ before anyone named the cause. If you own an older array with mysteriously fading strings at one end, PID is the first suspect, and anti-PID nighttime box solutions exist as retrofits.
What the Big Field Studies Actually Found
Warranty curves are promises; field data is truth. NREL's multi-decade PV degradation surveys — the reference dataset covering thousands of systems — found a median degradation rate around 0.5%/yr for modern modules, with the distribution's fat tail doing the teaching: the worst quartile degraded at 1%/yr or worse, and the spread between best and worst mattered more than the median. Translation: brand, batch, and climate selection move real money. Fraunhofer ISE's long-term European monitoring tells the same story with tighter clustering on premium glass-glass modules. And the oldest datapoint is almost charming: panels installed in the early 1980s at test sites still produce at 70–80% of nameplate after 40 years — silicon doesn't wear out on any timeline a mortgage cares about.
The fat tail is why we reject entire pallets over handling damage and why "which factory, which line, which quarter" is a real question on large orders. Two modules with identical datasheets can degrade at meaningfully different rates based on lamination quality alone, and field data — not spec sheets — is the only way to know which is which. PVEL's annual scorecard exists to compress that learning for buyers; top performers in their damp-heat and thermal-cycling sequences are the modules whose year-15 behavior you can actually predict.
Bifacial and Glass-Glass: The Durability Bonus Nobody Prices In
The industry's shift to glass-glass (dual-glass) module construction happened for bifacial production, but it smuggled in a degradation benefit: glass doesn't breathe. Backsheet polymers slowly transmit moisture and oxygen over decades, hydrolyzing encapsulants and corroding cell metallization — one of the quiet compounding mechanisms in the annual rate. A second sheet of glass seals the laminate hermetically. Field data on glass-glass modules shows consistently lower long-term degradation, which is why most 30-year performance warranties attach to dual-glass products. The trade-offs are weight (roughly 15–20% heavier), handling fragility at the edges during installation, and a modest price premium. For ground mounts, carports, and anything bifacial, glass-glass is the default answer now. For residential rooftops, quality glass-backsheet modules with POE encapsulants remain perfectly sound — the gap is real but second-order.
End of Life: Repowering and Recycling Economics
Eventually the math flips: the old array's degraded output no longer justifies its roof. Repowering — swapping 250W 2010-vintage modules for 450W+ modern panels on the same racking and interconnection — routinely doubles a site's production at half the cost of a new build, because permitting, interconnection, and much of the BOS already exist. Watch for two catches: racking compatibility (rail spacing and clamp ranges differ across module generations) and interconnection agreement limits (your export cap doesn't care that new panels could make more).
Recycling is the honest answer for the removed panels. Silicon modules are roughly 75% glass and 10% aluminum by weight — both trivially recyclable — with the valuable silver and the problematic traces in the laminate. US module recycling infrastructure matured from "theoretically possible" to genuinely operational in the mid-2020s, with per-panel costs of $10–25 depending on volume and logistics. Some manufacturers run take-back programs; ask before purchase, because the answer at end-of-life starts at procurement.
Climate-Specific Guidance: Match the Module to the Weather
Degradation risk is regional. In the desert Southwest, heat and UV dominate — specify modules with low temperature coefficients (HJT leads here at around −0.24%/°C versus −0.30 to −0.35%/°C for typical TOPCon and PERC) and insist on airflow-friendly racking. In the humid Southeast, PID resistance and corrosion certifications carry the load — POE encapsulant, anodized frames, sealed junction boxes. In snow country, mechanical load ratings (5,400 Pa front load is the serious-spec threshold) and clamp-zone discipline decide whether year ten looks like year one. Coastal installs within salt-spray range need IEC 61701 certification, full stop — we've replaced five-year-old uncertified arrays near the ocean whose frames looked like shipwreck salvage. Agricultural sites need IEC 62716 ammonia resistance. These certifications cost manufacturers real testing money; their presence on a datasheet is a quality signal that extends well beyond the specific hazard.
Reading Your Monitoring Data Like a Technician
Year-over-year comparison is the only honest degradation measurement a homeowner can make. Compare the same months across years — June against June — and normalize for weather using a reference: a nearby weather station's irradiance data, a neighbor's system, or your utility's solar index if published. A consistent 0.4–0.6% annual slide is your panel aging gracefully. A step change — May 2026 suddenly 8% below May 2025 — is equipment failure, not degradation, and the step-change pattern tells you where to look: whole system down points to the inverter; one string down points to a fuse, connector, or string-level fault; one panel's worth of production gone points to MLPE or a module problem. Set alert thresholds in your monitoring platform at 10% below expected and let the software watch while you live your life.
String Design Choices That Compound Over Decades
Two design decisions quietly interact with degradation. String sizing headroom: designing strings near the inverter's maximum input voltage leaves no room as panels age and voltage curves shift with temperature extremes — a string that clips cold-morning overvoltage protection in year twelve is a design failure, not a panel failure. And module-level electronics change the degradation conversation: with microinverters or optimizers, a single module's accelerated fade gets isolated instead of dragging its string-mates down to its level via current mismatch. On shaded or complex roofs, that mismatch protection alone can be worth 2–4% of lifetime production. Pair the right module with the right electronics and the degradation curve you bought is the one you get. Browse compatible architectures in our inverter collections and Enphase microinverter lineup.
Degradation in the Financial Model: The Commercial Negotiation
On financed commercial and utility projects, the degradation assumption is a negotiated number, not a datasheet readout. Lenders' engineers typically model P50 and P90 degradation cases, and a quarter-percent difference in the assumed annual rate moves a 25-year project's lifetime revenue by several percent — often the margin between bankable and not. This is where first-party test data earns its keep: modules with multiple independent lab cycles (PVEL, RETC, TÜV long-term sequences) support lower P90 degradation assumptions, which supports better financing terms, which pays for the premium module several times over. We've watched a customer save more on debt pricing from choosing the better-documented module than the module itself cost. On the residential side the same logic applies without the banker: the degradation rate is in your payback spreadsheet whether you typed it or not, so type the honest number for the actual panel you're buying.
Performance Warranty (Power Output Guarantee)
One practical note on performance guarantees versus warranties in commercial contracts: a production guarantee from your installer covers system output including soiling, downtime, and inverter losses; the module performance warranty covers only the panels' degradation. Know which document you're holding when year-nine production comes in low, because they send you to different counterparties with different remedies.
The One Habit That Protects Everything Else
If you take a single practice from this guide, take this one: record your baseline. On the day your system goes live, note the production in the first clean, sunny week. Save the commissioning report. Photograph the nameplates. Every degradation question you'll ever have — "is this normal," "should I file a claim," "did that hailstorm hurt anything" — gets answered against the baseline or argued into exhaustion without it. We keep baseline records for every system we supply into, and the customers who can produce theirs get faster, better answers than the ones reconstructing history from utility bills. The panels will fade slowly no matter what you do; the information doesn't have to.
Buying Panels With Degradation in Mind
If you're speccing a system today, the hierarchy is simple: N-type cell architecture (TOPCon, HJT, or back-contact), a performance warranty guaranteeing ≤0.4%/yr and ≥85% at year 25–30, a manufacturer with financial staying power, and certifications matching your environment (salt mist, ammonia, snow-load ratings). That combination is standard equipment in our N-type inventory — panels like the REC Alpha Pure-R 450W HJT, the Silfab NTC 530W, and Jinko 580W TOPCon bifacial exist on our shelves specifically because their degradation curves survive scrutiny. For help speccing the rest of the system around them, see the solar panel kits buyer's guide, the system components overview, and our system size calculator — or request a quote and we'll spec against your roof, climate, and 25-year math directly.