C&I BESS Peak Shaving and Demand Response: Revenue Stacking Guide
How commercial and industrial sites turn a 250 kW / 1 MWh battery into $50k–$140k/year of stacked revenue — peak shaving math, demand response markets, and dispatch logic that actually pencils.

Most commercial and industrial battery energy storage projects are sold on a single number: demand-charge savings. The story goes — your site pulls 400 kW peak, we shave 100 kW, your $30/kW-month demand charge drops by $3,000/month, and the BESS pays back in seven years. It's a real number, and it's not wrong. It's just incomplete.
A well-designed C&I BESS in the 100 kWh–5 MWh band actually generates revenue across four stacked value streams:
- Peak shaving — reduces monthly demand charges (always-on savings).
- Demand response (DR) capacity — pays for kW available to dispatch during grid events ($30–$180/kW-year in PJM, ISO-NE, ERCOT, NYISO, CAISO).
- Energy arbitrage — charges at off-peak TOU rates, discharges at on-peak (works where the on-peak/off-peak spread exceeds ~$0.12/kWh).
- Frequency regulation / ancillary services — payments for fast-response grid support in markets that accept storage bids (mostly PJM RegD, some CAISO AS).
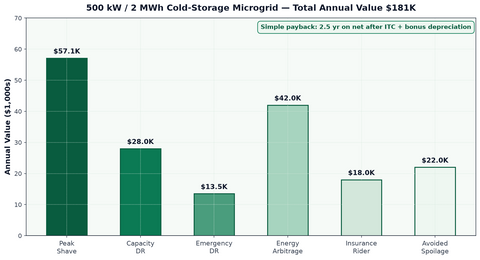
Layered correctly, a 250 kW / 1 MWh system in PJM captures roughly $58,000 to $92,000 per year across these four streams. The same system in a weak-DR territory (rural cooperative service, some Southeast IOUs) captures $22,000 to $34,000 — still cash-positive after ITC and bonus depreciation, but a much longer payback.
This guide walks through the actual dispatch math for each stream, the utility-territory maps that determine what's available, and the equipment configuration (PCS type, control interface, comms protocol) that unlocks each revenue source. If the BESS is committed to peak shaving only, everything else is unreachable — you cannot retroactively enroll a battery in DR after commissioning if the PCS wasn't specified for grid-following export.
Commercial electric rates in the US split into three components: customer charge (fixed monthly), energy charge ($/kWh, usually with TOU periods), and demand charge ($/kW of highest 15- or 30-minute average demand in the month). The demand component is where BESS pays back.
Two types of demand charge exist and they behave very differently:
- Non-coincident peak (NCP) demand — billed on the site's highest 15-min demand at any time during the billing month. Every C&I tariff has this. Battery discharge during the site's own peak shaves this number directly.
- Coincident peak (CP) or ratchet demand — billed on the site's demand during a utility-defined system peak window (e.g., PJM 5CP, ERCOT 4CP, NYISO ICAP). Battery discharge only during those specific hours affects this bill line, but the payoff per event is very high because the number ratchets for a full year in some tariffs.
A cold-storage warehouse in Pennsylvania with a 380 kW summer peak and a $28/kW-month NCP demand charge is paying $10,640/month in demand charges. Shaving 80 kW consistently saves $2,240/month, or $26,880/year in NCP alone. If the same warehouse is on a PJM Zone A CP tariff and the BESS discharges during the 5CP hours, the CP capacity charge drops by another $18,000–$22,000/year — a stackable second win.
The ROI calculator on the PES contractor portal takes utility bill PDFs (interval data preferred) and outputs peak-shave savings by tariff component, so the delta between NCP-only and NCP+CP is visible before the customer signs a proposal.
| Region / ISO | Typical C&I NCP $/kW-mo | CP or Ratchet Rate | Peak-Shave Window | Best BESS Duration |
|---|---|---|---|---|
| California (PG&E, SCE, SDG&E) | $22–$38 | N/A (TOU-heavy) | 4–9 PM year-round | 4 hr |
| New York (Con Ed, National Grid) | $28–$42 | ICAP tag (NYISO) | 1–7 PM summer | 4 hr |
| PJM (PA, NJ, MD, DC, VA) | $18–$32 | 5CP peak | 12–6 PM Jun–Sep | 4 hr |
| Texas (ERCOT — Oncor, Centerpoint) | $15–$28 | 4CP peak | 1–6 PM Jun–Sep | 2–4 hr |
| ISO-NE (MA, CT, RI, NH, VT, ME) | $14–$26 | ICAP peak | 1–7 PM summer | 4 hr |
| Midwest (MISO) | $12–$22 | Coincident hour | Varies | 2–4 hr |
| Southeast IOUs (Duke, Southern Co) | $10–$18 | Ratchet | 2–7 PM | 2 hr |
| Hawaii (HECO) | $18–$32 | N/A (TOU + export) | 5–9 PM | 4 hr |
Demand response programs pay the site to reduce or reverse load during grid-stress events. There are two kinds of DR from a BESS operator's perspective:
Reservation / capacity DR pays a flat $/kW-year for the site's commitment to be available during dispatch events, whether or not the events actually happen. PJM's Capacity Performance product is the largest and pays $30–$120/kW-year depending on delivery-year and zone. ISO-NE Forward Capacity Market runs $40–$70/kW-year. NYISO ICAP pays $40–$180/kW-year depending on zone.
Energy DR pays per kWh reduced or exported during a specific event window — typically 2 to 4 hours, called 10 to 60 times per year. Payment rates run $250–$1,200/MWh depending on market conditions and event type.
The mechanics: a DR aggregator (CPower, Voltus, Enel X, Enerwise, or a utility-run program) enrolls the site, integrates with the BESS controls via OpenADR 2.0b or a proprietary API, and dispatches events with 30-min to 2-hour notice. The BESS responds automatically — the site does not need to manually intervene. Payments flow monthly (capacity) or per-event (energy).
Not every BESS PCS is DR-compatible out of the box. Grid-following PCS with export permission and OpenADR 2.0b support is the minimum. Sol-Ark 15K-2P, EG4 18kPV, Sungrow SG250HX, Schneider XW+ 6848, and every containerized system PES ships support this natively. Older residential-grade inverters and some low-cost imports do not.
Energy arbitrage is the "buy low, sell high" of BESS operation: charge the battery when energy is cheap (overnight off-peak, midday solar oversupply), discharge when energy is expensive (evening peak). The economics depend entirely on the on-peak/off-peak spread.
Rules of thumb:
- Spread < $0.08/kWh — arbitrage does not cover round-trip losses. Skip it.
- Spread $0.08–$0.15/kWh — arbitrage is a small tertiary revenue stream. Enable it, but don't count on it in the pro forma.
- Spread > $0.15/kWh — arbitrage becomes a real dispatch mode. California TOU-E 8, Hawaii, some New York territories, and PJM day-ahead LMPs at solar-heavy substations can produce this spread.
Arbitrage revenue is capped by battery cycle life. Every arbitrage cycle counts against the 6,000-cycle warranty on Fortress, BYD, and Pytes LFP systems. A 1 MWh BESS running 300 arbitrage cycles/year at a $0.12 spread earns $36,000/year in arbitrage — but consumes 5% of warranty life. Net-net, arbitrage pays when spreads are strong and skips when they are marginal.
The ROI calculator models arbitrage under three cycle-life scenarios so the contractor can show the customer the tradeoff explicitly.
-
1
Pull the last 12 months of utility bills AND 15-min interval data.
Bills alone show demand-charge structure. Interval data shows the shape of the peak — a spiky 380 kW peak with 60 events/month is a peak-shave slam-dunk; a flat 380 kW peak across 8 hours is much harder to shave because the battery has to run at full discharge for the entire on-peak window.
-
2
Model NCP savings first, then layer CP or ratchet savings.
NCP savings are the reliable base case. CP savings depend on correctly predicting the utility's 5CP or 4CP hours (PJM, ERCOT); miss one, and the ratchet resets. Use the ROI calculator to run both scenarios.
-
3
Query the local DR aggregators before spec'ing the BESS size.
DR revenue is capacity-based — the aggregator will pay for the kW you commit. Undersizing means leaving DR revenue on the table; oversizing means paying for battery you can't recover through peak shaving alone. In PJM Zone A, a site with a 100 kW peak-shave need often makes more sense at 250 kW / 1 MWh because the incremental 150 kW earns $18,000+/year in DR.
-
4
Spec a PCS with OpenADR 2.0b, grid-following export, and 4-quadrant operation.
This is the equipment gate. Sol-Ark 15K-2P, EG4 18kPV, Sungrow SG250HX, Schneider XW+ 6848, and the containerized 500 kWh–5 MWh systems all clear this. Residential-grade wall-mount inverters do not.
-
5
Wire the BESS behind the revenue-grade meter, not in front.
BTM (behind the meter) installation captures peak-shave and DR through the customer's utility account. FTM (front of meter) requires an interconnection agreement and turns the project into a wholesale market participant. 95% of C&I projects are BTM.
-
6
Integrate with a DR aggregator API during commissioning, not after.
CPower, Voltus, and Enel X each have their own API and enrollment paperwork. Fold it into the commissioning week — retrofitting DR six months later requires a second technician visit and often a firmware update.
-
7
Instrument revenue reporting into the customer dashboard.
Peak-shave savings, DR events, arbitrage cycles, and cycle-life consumed should all appear in the customer-facing dashboard. This is what turns a one-time BESS sale into a multi-year account relationship — the customer sees value monthly, not annually at reconciliation.
PES's most-quoted C&I BESS configuration is a 250 kW / 1 MWh system built around either a containerized outdoor unit or a Fortress Avalon HV Pro Business stack behind a Sol-Ark 30K-3P three-phase inverter set. Here is the actual pro forma for a Pennsylvania cold-storage site in PJM Zone A:
250 kW / 1 MWh BESS in PJM Zone A — 4-Year Revenue Stack
- System capex (installed, commissioned): $412,000
- ITC 30% + 10% domestic + 10% energy community: ($206,000)
- Bonus depreciation NPV (60% × 79% basis × 21% rate): ($41,000)
- Net installed cost after tax: $165,000
- Peak-shave savings (80 kW NCP × $28 × 12): +$26,880/yr
- PJM Capacity Performance (200 kW × $70): +$14,000/yr
- PJM emergency energy DR (avg 25 events × 200 kW × 3 hr × $450/MWh): +$6,750/yr
- PA Act 129 energy efficiency payments: +$3,200/yr
- Total annual revenue: $50,830/yr
- Simple payback on net cost: 3.25 years
- Simple payback on gross cost: 8.1 years
- 10-year net revenue: $508,300 vs $165,000 net cost = $343,300 net profit
This is not the highest possible revenue — a site with better DR fit or a higher demand charge can exceed $70,000/year. It is also not the lowest — a site with only NCP savings and no DR access lands at $25,000–$30,000/year.
Not every US territory has active DR markets. If you sell a BESS on stacked revenue in one of these regions, the pro forma won't match reality at year 1:
- SERC territory rural cooperatives — DR programs exist but pay $8–$25/kW-year. Peak shaving is the primary play.
- TVA territory — Very limited DR; capacity market is not open to third-party aggregators.
- SPP (Southwest Power Pool) — DR pilots only. Not enough scale for a bankable revenue stream.
- Alaska, Puerto Rico, most territories — Vertical utility, no DR market.
- Some regulated states (Georgia, Florida IOUs) — DR pays but is utility-controlled with rate caps.
In these territories, sell the BESS on NCP demand-charge savings and CP/ratchet capture where available, plus resiliency value if the site has outage exposure. DR revenue enters the pro forma only as an upside line, not a base case.
Most C&I demand tariffs bill on the current month's peak. Some — including several major Southeast and Midwest utilities — use a ratchet: the demand billed in any month cannot be less than a percentage of the highest peak in the past 12 months. Common ratchet structures:
- 80% of prior-year summer peak — winter months bill at 80% of the summer peak even when actual winter load is lower.
- Twelve-month rolling ratchet — any month's billed demand is the greater of actual demand or 75–90% of the 12-month maximum.
Ratchets change the peak-shave math significantly. In a non-ratchet tariff, a single un-shaved peak in one month costs $2,400 (80 kW × $30). In a ratchet tariff with an 80% multiplier, the same un-shaved peak costs $23,040 — because it ratchets the demand charge for 12 months.
The implication: on a ratchet tariff, the BESS must reliably shave every peak, all year. A single missed event (BMS software update in progress, low SOC after a DR event, battery derated for high ambient temperature) resets the ratchet and burns 12 months of subsequent savings.
Design implications for ratchet-tariff BESS:
- Size the BESS 20–30% larger than the peak-shave requirement to hold reserve capacity.
- Configure the BMS to prioritize peak-shave over DR — decline DR events if state-of-charge is below a threshold.
- Never let the BESS go fully offline for maintenance during a billing month; schedule work in off-peak months if possible, or arrange for a portable generator to cover the shave window.
- Confirm the tariff's ratchet mechanics in writing with the utility account representative before signing the BESS PO.
Beyond DR capacity payments and demand charge savings, most utilities offer rider programs that pay for BESS deployment or discounted energy for storage owners. These are utility-specific, often underpublicized, and are the difference between a marginal project and a strong one:
- California SGIP (Self-Generation Incentive Program) — direct rebate of $200–$1,000/kWh depending on customer type and program tier. Non-residential storage tier pays substantial amounts on projects in medical, agricultural, and food-service categories.
- Massachusetts SMART (Solar Massachusetts Renewable Target) — 20-year fixed-payment program for solar+storage; battery-adder tiers meaningfully improve project economics.
- NYSERDA Retail Storage Program — pays $200–$350/kWh for behind-the-meter storage in Con Ed and PSEG-LI territories.
- Puerto Rico DEQP Program — significant subsidies for post-Maria resiliency-focused storage.
- Connecticut Energy Storage Solutions — up-front rebate plus performance payments over 10 years.
- ConEd Storage Battery Program — territory-specific incentives for storage that helps defer distribution upgrades.
- Xcel Colorado / Minnesota Battery Connect — Xcel-managed dispatch program that pays for BESS availability.
- PG&E, SCE Battery Bonus programs — periodic time-limited incentives that stack with SGIP.
Every project that goes through PES with a utility service address in a rider-eligible territory gets checked against active programs. The paperwork is filed alongside the ITC package, so the customer doesn't have to run parallel applications.
Every serious C&I BESS proposal starts with 15-minute interval data — the actual site load in 96 measurements per day, 35,040 per year. Utilities provide this on request; some make it available through customer portals (PG&E Green Button, National Grid, Con Ed My Account), others require a written request and a 5–10 business day wait.
Without interval data, the BESS design is guesswork. Common failure mode: the contractor sizes the BESS from monthly demand bills, deploys it, and discovers the site's peak is a 3-second spike (a compressor motor start, a large chiller cycle) that the BESS cannot see fast enough to shave. The demand charge doesn't move; the project underdelivers.
The interval-data analysis walks through:
- Compute the maximum 15-minute demand for each month over the past 12 months (this is what the tariff bills on).
- Identify the shape of the peak — is it a sustained plateau (easy to shave) or a spike (harder)?
- Identify the time-of-day of the peak — is it consistent across months (easy to schedule) or varies (harder)?
- Count the peak events per month — a site with 6 peak events per month at $28/kW-mo is 6 shave-attempts against $840 each; a site with one flat peak all month is one shave-attempt against $5,600.
- Overlay the utility TOU schedule to identify arbitrage windows.
- Overlay any DR aggregator's dispatch history for the region to model DR event coincidence with peak load.
PES's ROI calculator ingests interval data (CSV or Green Button XML) and produces the analysis automatically. For contractors without the calculator access, the interval-data walk-through is documented in the PES contractor guide series.
A BESS with peak shave, DR, arbitrage, and backup modes all enabled has a decision to make every 15 minutes: which mode gets which fraction of the available energy? The BMS handles this through a priority stack — a configured ordering of modes with SOC thresholds for each.
A typical C&I priority stack:
- Backup reserve — 20% SOC always held for grid-outage response. Not dispatched for any other purpose.
- Peak shave commitment — enough SOC held to cover the day's expected peak window. If the peak is 4 hours at 100 kW, hold 400 kWh above the backup reserve.
- DR dispatch reserve — held during forecast DR-event windows (typically noon-8pm in summer). Released back to the general pool outside those windows.
- Arbitrage discharge — dispatched during on-peak TOU hours from the pool remaining after backup, peak shave, and DR reserve.
- Grid-supportive services — frequency regulation and other services that use small energy fractions but require fast response.
The stack is configured at commissioning and can be adjusted seasonally. Summer configurations prioritize peak shave and DR; winter configurations often shift emphasis to arbitrage and backup reserve. DERMS platforms let this be automated based on forecast; simpler BMS configurations use manual seasonal switches.
Peak-shave and DR economics are territory-specific in ways that generic ROI models mask. Below are five representative territories with actual tariff structure, DR market access, and 2026 revenue models for a 250 kW / 1 MWh BESS at a mid-C&I site.
Con Edison Zone J (New York City) — Service Class 9 rate with $32–$42/kW-mo NCP demand plus NYISO ICAP capacity for the zone. A 250 kW / 1 MWh system typically captures $28,000/yr in NCP savings, $22,000/yr in NYISO ICAP, and $5,000–$9,000 in event-based DR. Total $55K–$59K/yr. Con Ed also has a "Non-Wires Alternative" program that pays additional adders in specific distribution circuits.
PG&E B-19 (California commercial secondary) — TOU-heavy tariff with high demand charges during peak windows ($30–$38/kW-mo effective). Combined with SGIP rebate ($200–$400/kWh depending on tier) and CAISO Proxy DR ($40–$80/kW-yr). A 250 kW / 1 MWh system with SGIP typically shows first-year cash flow that fully covers the after-ITC net cost, driven mainly by SGIP + demand savings.
PJM Zone A (Pennsylvania, New Jersey) — Moderate NCP demand ($22–$32/kW-mo) with active PJM Capacity Performance market ($70–$120/kW-yr depending on delivery year). Emergency energy DR adds 25 events/year at $450/MWh. A 250 kW / 1 MWh system runs $50K–$62K/yr revenue.
ERCOT Oncor territory (Dallas-Fort Worth) — Lower NCP demand ($15–$24/kW-mo) but strong summer peak driven by 4CP ratchet. Emergency Response Service (ERS) pays $30–$80/kW-yr for BESS availability during grid stress. Total revenue on a 250 kW / 1 MWh system typically $32K–$42K/yr, higher during years with tight summer capacity margins.
Rural cooperative (unspecified region) — Peak-shave-only economics. NCP demand $8–$15/kW-mo, no active DR market, no state incentive. A 250 kW / 1 MWh system runs $18K–$28K/yr revenue. Payback is longer (7–10 years gross) but still positive after ITC and bonus depreciation.
These are representative. Every project needs its own tariff analysis; PES's ROI calculator ingests the specific rate schedule and interval data to model actual revenue.
Every dispatch cycle counts against the battery's warrantied cycle life. LFP systems in the C&I band ship with 6,000-cycle warranties at 70% end-of-life capacity. Understanding this budget is critical to revenue optimization.
Cycle consumption by dispatch mode:
- Peak shaving — 15–30 partial cycles per month on typical sites. Uses 1.5–3% of cycle budget per year. Very cycle-efficient.
- Capacity DR (reservation) — 0 cycles unless dispatched. Dispatched events add ~1 full cycle each.
- Emergency energy DR — each event is ~1 full cycle. 20–40 events/yr uses 3–7% of cycle budget.
- Energy arbitrage — 1 full cycle per day if aggressively dispatched. Uses 5–7% of cycle budget per year if used year-round.
- Frequency regulation — very high — 10–30 partial cycles per day depending on market signal. Not compatible with standard warranty; requires specialized products.
Combined dispatch profile for a well-designed system: peak shave + capacity DR + moderate arbitrage typically consumes 10–13% of cycle budget per year. This lands the battery at 65–70% cumulative cycle usage at end of year 10 — comfortably within warranty at end-of-warranty capacity.
Frequency regulation and full-cycle daily arbitrage together can consume 25–35% of cycle budget per year, breaching warranty at year 4 or 5. Systems designed for this profile need specialized warranties (available from some containerized OEMs) or the customer accepts out-of-warranty operation past year 4.
The most sophisticated C&I BESS deployments participate directly in real-time energy markets rather than only through DR aggregators. This requires a bidding-capable DERMS or a partnership with a wholesale-market bidder. Not every site can or should do this, but for large 2 MWh+ systems in strong market territories (PJM, CAISO, ERCOT day-ahead LMPs at solar-heavy substations), the incremental revenue can be $8K–$18K/yr on top of standard DR.
The mechanics: the DERMS or its partner submits bids into the day-ahead energy market for the next-day operating hours. The market clears; some bids are accepted, others rejected. During operating hours, the DERMS dispatches the BESS according to the cleared schedule. Revenue flows from the ISO settlement process, typically 5–7 weeks after the operating day.
The complexity: energy market participation requires the site to be enrolled as a market participant (through a wholesale-market service provider like Enel X, Voltus wholesale, Enerwise, or a specialty firm), the DERMS to speak the ISO's bidding protocol, and the BESS to respond to dispatch instructions within market-defined windows. Setup takes 2–4 months.
For most C&I sites in the 100 kWh–1 MWh band, DR aggregator participation is the right level of market engagement. Wholesale market bidding enters the picture at 1 MWh+ where the incremental revenue justifies the complexity.
How much demand can a 100 kWh BESS actually shave?
What's the difference between a DR aggregator and enrolling directly with the utility?
Can the BESS still peak-shave while enrolled in DR?
Does the BESS need internet to participate in DR?
What happens to the DR revenue if the site loses grid power?
How many DR events are dispatched per year in each market?
Does frequency regulation actually pay?
Model Your Site's BESS Revenue Stack
Use the ROI calculator on the contractor portal to model peak shaving, DR capacity, and arbitrage against your utility's actual tariff and interval data.
Register Now